4864
Views
1555
Downloads |
Employment protection reforms and labour market outcomes in the aftermath of the recession: Evidence from Croatia
Iva Tomić* 
 Iva Tomić
Affiliation:
Iva Tomić
Affiliation: Institute of Economics, Zagreb, Department for Labor Markets and Social Policy, Zagreb, Croatia
 0000-0002-4706-7881
Correspondence
itomic@eizg.hr 0000-0002-4706-7881
Correspondence
itomic@eizg.hr
Article | Year: 2020 | Pages: 3 - 39 | Volume: 44 | Issue: 1 Received: June 1, 2019 | Accepted: November 13, 2019 | Published online: March 3, 2020
|

FULL ARTICLE
FIGURES & DATA
REFERENCES
CROSSMARK POLICY
METRICS
LICENCING
PDF
|
|
2008
|
2013
|
2014
|
|
EP for regular contracts (EPR)
|
2.55
|
2.55
|
2.28
|
|
EP against collective dismissals (EPC)
|
3.75
|
3.00
|
2.25
|
|
EP for temporary contracts (EPT)
|
2.21
|
1.96
|
1.96
|
|
EP for regular open-ended contracts including
collective dismissals (EPRC)
|
2.89
|
2.68
|
2.27
|
|
Ratio of EPT and EPR
|
0.87
|
0.77
|
0.86
|
|
Ratio of EPT and EPRC
|
0.76
|
0.73
|
0.86
|
Notes: Values represent EPL indices based on OECD methodology. Source: Kunovac (2014) and CNB (2014).
Notes: Monthly data are extracted from yearly datasets. No weights are included. Circles represent share of employed/employees in the total working-age (15-64) population and/or share of temporary employees/fixed-term contracts among all employees aged 15-64, while lines represent local linear smoothing plot. Source: Author’s calculation based on Croatian LFS.
Note: Results are from linear probability model with robust standard errors. Employment share includes only employees (15-64) and not self-employed persons and family workers. Quarterly data are extracted from yearly datasets. Regressions control for a basic set of individual characteristics, i.e., age dummies, gender, marriage status and nativity plus time trend and quarterly GDP growth rate. Other model specifications – such as those additionally including education, region and level of urbanisation – are also tested and the results are more or less the same (available upon request). Source: Author’s calculation based on Croatian LFS.
|
Marginal effects
|
Temporary employment (within employees)
|
Total employees (within active)
|
|
Both reform variables
|
Cumulative effect
|
Only EPR reform
|
Both reform variables
|
Cumulative effect
|
Only EPR reform
|
|
EPT liberalisation
(2013m7-2014m7)
|
0.015***
|
|
|
-0.002
|
|
|
|
(0.005)
|
|
|
(0.006)
|
|
|
|
EPR liberalisation
(2014m8-2017m12)
|
0.042***
|
|
0.032***
|
0.068***
|
|
0.069***
|
|
(0.005)
|
|
(0.004)
|
(0.006)
|
|
(0.005)
|
|
Both reforms
(2013m7-2017m12)
|
|
0.025***
|
|
|
0.024***
|
|
|
|
(0.005)
|
|
|
(0.005)
|
|
Notes: Besides the reform variables presented, these model specifications include a basic set of individual characteristics, i.e., age dummies, gender, marriage status, nativity and education level, plus urbanisation and region dummies as well as time trend and quarterly GDP growth rate. Employment share includes only employees (15-64) and not self-employed persons and family workers. More detailed information on probit regressions, including other model specifications, is available in the Appendix and upon request. Robust standard errors in parentheses. *** p<0.01, ** p<0.05, * p<0.1. Source: Author’s calculation based on Croatian LFS.
|
Marginal effects
|
Temporary employment (within employees)
|
Total employees (within active)
|
|
Both reform variables
|
Cumulative effect
|
Only EPR reform
|
Both reform variables
|
Cumulative effect
|
Only EPR reform
|
|
EPT liberalisation
(2013m7-2014m7)
|
0.015***
|
|
|
-0.004
|
|
|
|
(0.005)
|
|
|
(0.00598)
|
|
|
|
EPR liberalisation
(2014m8-2017m12)
|
0.037***
|
|
0.027***
|
0.044***
|
|
0.047***
|
|
(0.005)
|
|
(0.004)
|
(0.006)
|
|
(0.005)
|
|
Both reforms
(2013m7-2017m12)
|
|
0.023***
|
|
|
0.014**
|
|
|
|
(0.004)
|
|
|
(0.006)
|
|
Notes: Besides the reform variables presented, these model specifications include a basic set of individual characteristics, i.e., age dummies, gender, marriage status, nativity and education level, plus urbanisation and region dummies as well as time trend and quarterly GDP growth rate. Employment share includes only employees (30-64) and not self-employed persons or family workers. More detailed information on probit regressions is available upon request. Robust standard errors in parentheses. *** p<0.01, ** p<0.05, * p<0.1. Source: Author’s calculation based on Croatian LFS.
|
Marginal effects
|
Fixed-term contracts
(against permanent)
|
Temporary employment
(within employment)
|
Total employment
(within active)
|
|
Both reform variables
|
Cumulative effect
|
Only EPR reform
|
Both reform variables
|
Cumulative effect
|
Only EPR reform
|
Both reform variables
|
Cumulative effect
|
Only EPR reform
|
|
EPT liberalisation
(2013m7-2014m7)
|
0.010**
|
|
|
0.015***
|
|
|
-0.011***
|
|
|
|
(0.005)
|
|
|
(0.004)
|
|
|
(0.004)
|
|
|
|
EPR liberalisation
(2014m8-2017m12)
|
0.029***
|
|
0.023***
|
0.040***
|
|
0.030***
|
0.044***
|
|
0.051***
|
|
(0.005)
|
|
(0.004)
|
(0.004)
|
|
(0.004)
|
(0.004)
|
|
(0.003)
|
|
Both reforms
(2013m7-2017m12)
|
|
0.017***
|
|
|
0.024***
|
|
|
0.008**
|
|
|
|
(0.004)
|
|
|
(0.004)
|
|
|
(0.004)
|
|
Notes: Besides the reform variables presented, these model specifications include a basic set of individual characteristics, i.e., age dummies, gender, marriage status, nativity and education level, plus urbanisation and region dummies as well as time trend and quarterlyGDP growth rate. More detailed information on probit regressions is available upon request. Robust standard errors in parentheses. *** p<0.01, ** p<0.05, * p<0.1. Source: Author’s calculation based on Croatian LFS.
Note: Results are from linear probability model with robust standard errors. Employment share includes only employees (30-64) and not self-employed persons and family workers. Quarterly data are extracted from yearly datasets. Regressions control for a basic set of individual characteristics, i.e., age dummies, gender, marriage status and nativity plus time trend and quarterly GDP growth rate. Other model specifications – such as those additionally including education, region and level of urbanisation – are also tested and the results are more or less the same (available upon request). Source: Author’s calculation based on Croatian LFS.
Note: Results are from linear probability model with robust standard errors. Quarterly data are extracted from yearly datasets. Regressions control for basic set of individual characteristics, i.e., age dummies, gender, marriage status and nativity plus time trend and quarterly GDP growth rate. Other model specifications – such as those additionally including education, region and level of urbanisation – are also tested and the results are more-or-less the same (available upon request). Source: Author’s calculation based on Croatian LFS.
|
Variables
|
Total
|
Employed
|
Employees
|
Temporary
employees
|
|
Mean
|
Std. Dv.
|
Mean
|
Std. Dv.
|
Mean
|
Std. Dv.
|
Mean
|
Std. Dv.
|
|
Labour market
status
|
|
|
|
|
|
|
|
|
|
Active
|
0.65
|
0.48
|
|
|
|
|
|
|
|
Employees
|
0.47
|
0.50
|
0.83
|
0.38
|
|
|
|
|
|
Self-employed
|
0.15
|
0.36
|
0.15
|
0.36
|
|
|
|
|
|
Temporary employees
|
0.16
|
0.36
|
0.16
|
0.36
|
0.16
|
0.36
|
|
|
|
Fixed-term contracts only
|
0.13
|
0.34
|
0.13
|
0.34
|
0.13
|
0.34
|
0.85
|
0.35
|
|
Precarious employment
|
0.05
|
0.22
|
0.05
|
0.22
|
0.05
|
0.22
|
0.33
|
0.47
|
|
Age
|
|
|
|
|
|
|
|
|
|
15-19 (ref.)
|
0.09
|
0.28
|
0.01
|
0.10
|
0.01
|
0.10
|
0.04
|
0.20
|
|
20-24
|
0.09
|
0.29
|
0.06
|
0.24
|
0.07
|
0.25
|
0.19
|
0.40
|
|
25-29
|
0.10
|
0.30
|
0.12
|
0.32
|
0.13
|
0.34
|
0.24
|
0.43
|
|
30-34
|
0.10
|
0.30
|
0.14
|
0.35
|
0.15
|
0.35
|
0.16
|
0.37
|
|
35-39
|
0.10
|
0.30
|
0.14
|
0.35
|
0.14
|
0.35
|
0.11
|
0.31
|
|
40-44
|
0.10
|
0.30
|
0.14
|
0.34
|
0.14
|
0.34
|
0.08
|
0.28
|
|
45-49
|
0.11
|
0.31
|
0.13
|
0.34
|
0.13
|
0.34
|
0.07
|
0.26
|
|
50-54
|
0.11
|
0.31
|
0.13
|
0.33
|
0.12
|
0.33
|
0.06
|
0.23
|
|
55-59
|
0.11
|
0.31
|
0.09
|
0.29
|
0.08
|
0.28
|
0.03
|
0.18
|
|
60-64
|
0.09
|
0.29
|
0.04
|
0.20
|
0.03
|
0.18
|
0.01
|
0.10
|
|
Individual/household characteristics
|
|
|
|
|
|
|
|
Female
|
0.50
|
0.50
|
0.45
|
0.50
|
0.47
|
0.50
|
0.48
|
0.50
|
|
Married
|
0.59
|
0.49
|
0.68
|
0.47
|
0.66
|
0.47
|
0.43
|
0.50
|
|
Foreign
|
0.11
|
0.31
|
0.10
|
0.30
|
0.10
|
0.30
|
0.10
|
0.31
|
|
Share of dependent persons in the household
|
0.14
|
0.18
|
0.15
|
0.18
|
0.15
|
0.18
|
0.13
|
0.17
|
|
Education
|
|
|
|
|
|
|
|
|
|
Low skilled (ref.)
|
0.23
|
0.42
|
0.13
|
0.33
|
0.09
|
0.29
|
0.11
|
0.31
|
|
Medium skilled
|
0.60
|
0.49
|
0.64
|
0.48
|
0.65
|
0.48
|
0.68
|
0.46
|
|
High skilled
|
0.17
|
0.37
|
0.24
|
0.42
|
0.25
|
0.43
|
0.21
|
0.41
|
|
Area variables
|
|
|
|
|
|
|
|
|
|
Urban
|
0.61
|
0.49
|
0.62
|
0.49
|
0.65
|
0.48
|
0.60
|
0.49
|
|
Central Croatia (w/o Zagreb) (ref.)
|
0.23
|
0.42
|
0.24
|
0.43
|
0.23
|
0.42
|
0.22
|
0.41
|
|
East Croatia
|
0.19
|
0.39
|
0.16
|
0.37
|
0.15
|
0.36
|
0.20
|
0.40
|
|
Zagreb region
|
0.25
|
0.43
|
0.27
|
0.45
|
0.29
|
0.45
|
0.22
|
0.42
|
|
North Adriatic
|
0.13
|
0.33
|
0.14
|
0.35
|
0.14
|
0.35
|
0.13
|
0.34
|
|
South Adriatic
|
0.20
|
0.40
|
0.18
|
0.39
|
0.19
|
0.39
|
0.23
|
0.42
|
|
County unemployment rate
|
0.19
|
0.08
|
0.18
|
0.08
|
0.18
|
0.08
|
0.19
|
0.08
|
|
State of the economy
|
|
|
|
|
|
|
|
|
|
GDP growth rate (qoq)
|
0.05
|
1.21
|
0.05
|
1.23
|
0.06
|
1.22
|
0.17
|
1.12
|
|
GDP growth rate (yoy)
|
0.34
|
3.46
|
0.36
|
3.51
|
0.41
|
3.48
|
0.82
|
3.27
|
|
Firm characteristics
|
|
|
|
|
|
|
|
|
|
Public sector
|
0.36
|
0.48
|
0.36
|
0.48
|
0.36
|
0.48
|
0.21
|
0.41
|
|
Small firm (ref.)
|
0.57
|
0.50
|
0.57
|
0.50
|
0.56
|
0.50
|
0.68
|
0.47
|
|
Medium firm
|
0.20
|
0.40
|
0.20
|
0.40
|
0.21
|
0.40
|
0.16
|
0.37
|
|
Large firm
|
0.23
|
0.42
|
0.23
|
0.42
|
0.23
|
0.42
|
0.16
|
0.37
|
|
Occupation (Managers - ref.)
|
|
|
|
|
|
|
|
|
|
Professionals
|
0.14
|
0.35
|
0.14
|
0.35
|
0.16
|
0.36
|
0.12
|
0.32
|
|
Technicians
|
0.15
|
0.35
|
0.15
|
0.35
|
0.17
|
0.37
|
0.12
|
0.32
|
|
Clerks
|
0.11
|
0.31
|
0.11
|
0.31
|
0.13
|
0.33
|
0.10
|
0.31
|
|
Service & sales
|
0.18
|
0.38
|
0.18
|
0.38
|
0.19
|
0.39
|
0.26
|
0.44
|
|
Agriculture
|
0.08
|
0.27
|
0.08
|
0.27
|
0.01
|
0.08
|
0.01
|
0.09
|
|
Craftsmen
|
0.13
|
0.33
|
0.13
|
0.33
|
0.13
|
0.34
|
0.13
|
0.33
|
|
Plant/machine operators
|
0.10
|
0.31
|
0.10
|
0.31
|
0.12
|
0.32
|
0.11
|
0.32
|
|
Elementary occupations
|
0.07
|
0.26
|
0.07
|
0.26
|
0.08
|
0.27
|
0.15
|
0.35
|
|
Industry (Agriculture, forestry and fishing - ref.)
|
|
|
|
|
|
|
|
Industry (except manufacturing & construction)
|
0.03
|
0.17
|
0.03
|
0.17
|
0.04
|
0.19
|
0.02
|
0.13
|
|
Manufacturing
|
0.18
|
0.38
|
0.18
|
0.38
|
0.20
|
0.40
|
0.18
|
0.39
|
|
Construction
|
0.08
|
0.27
|
0.08
|
0.27
|
0.08
|
0.27
|
0.09
|
0.28
|
|
Wholesale and retail trade, transport, accommodation and food service
activities + communication
|
0.30
|
0.46
|
0.30
|
0.46
|
0.31
|
0.46
|
0.39
|
0.49
|
|
Financial, insurance and real estate activities
|
0.03
|
0.18
|
0.03
|
0.18
|
0.04
|
0.19
|
0.02
|
0.15
|
|
Public administration, defence, education, human health and social work
activities
|
0.19
|
0.39
|
0.19
|
0.39
|
0.23
|
0.42
|
0.15
|
0.36
|
|
Other services
|
0.09
|
0.29
|
0.09
|
0.29
|
0.09
|
0.28
|
0.11
|
0.31
|
|
Observations
|
275,034
|
148,022
|
120,705
|
18,362
|
|
Marginal effects
|
Both reform variables
|
Cumulative effect
|
Only EPR reform
|
|
(1)
|
(2)
|
(3)
|
(4)
|
(1)
|
(2)
|
(3)
|
(4)
|
(1)
|
(2)
|
(3)
|
(4)
|
|
EPT liberalisation
(2013m7-2014m7)
|
0.0402***
|
0.0149***
|
0.0154***
|
0.0118**
|
|
|
|
|
|
|
|
|
|
(0.00399)
|
(0.00501)
|
(0.00500)
|
(0.00481)
|
|
|
|
|
|
|
|
|
|
EPR liberalisation
(2014m8-2017m12)
|
0.0836***
|
0.0421***
|
0.0420***
|
0.0321***
|
|
|
|
|
0.0776***
|
0.0320***
|
0.0315***
|
0.0241***
|
|
(0.00242)
|
(0.00547)
|
(0.00546)
|
(0.00525)
|
|
|
|
|
(0.00235)
|
(0.00430)
|
(0.00430)
|
(0.00415)
|
|
Both reforms
(2013m7-2017m12)
|
|
|
|
|
0.0742***
|
0.0246***
|
0.0249***
|
0.0192***
|
|
|
|
|
|
|
|
|
|
(0.00228)
|
(0.00461)
|
(0.00460)
|
(0.00443)
|
|
|
|
|
|
Age: 15-19
(ref.)
|
|
|
|
|
|
|
|
|
|
|
|
|
|
20-24
|
-0.243***
|
-0.245***
|
-0.247***
|
-0.242***
|
-0.243***
|
-0.246***
|
-0.248***
|
-0.243***
|
-0.244***
|
-0.245***
|
-0.248***
|
-0.243***
|
|
(0.0166)
|
(0.0165)
|
(0.0167)
|
(0.0178)
|
(0.0166)
|
(0.0166)
|
(0.0168)
|
(0.0178)
|
(0.0165)
|
(0.0165)
|
(0.0167)
|
(0.0178)
|
|
25-29
|
-0.380***
|
-0.383***
|
-0.381***
|
-0.359***
|
-0.380***
|
-0.384***
|
-0.382***
|
-0.361***
|
-0.379***
|
-0.383***
|
-0.381***
|
-0.360***
|
|
(0.0161)
|
(0.0161)
|
(0.0163)
|
(0.0174)
|
(0.0162)
|
(0.0161)
|
(0.0164)
|
(0.0174)
|
(0.0160)
|
(0.0161)
|
(0.0163)
|
(0.0174)
|
|
30-34
|
-0.487***
|
-0.491***
|
-0.488***
|
-0.453***
|
-0.487***
|
-0.492***
|
-0.489***
|
-0.454***
|
-0.486***
|
-0.492***
|
-0.489***
|
-0.454***
|
|
(0.0161)
|
(0.0161)
|
(0.0164)
|
(0.0175)
|
(0.0162)
|
(0.0161)
|
(0.0164)
|
(0.0175)
|
(0.0160)
|
(0.0161)
|
(0.0163)
|
(0.0175)
|
|
35-39
|
-0.537***
|
-0.542***
|
-0.537***
|
-0.495***
|
-0.537***
|
-0.543***
|
-0.538***
|
-0.496***
|
-0.536***
|
-0.542***
|
-0.538***
|
-0.496***
|
|
(0.0161)
|
(0.0161)
|
(0.0163)
|
(0.0175)
|
(0.0162)
|
(0.0161)
|
(0.0164)
|
(0.0175)
|
(0.0160)
|
(0.0161)
|
(0.0163)
|
(0.0175)
|
|
40-44
|
-0.558***
|
-0.563***
|
-0.558***
|
-0.514***
|
-0.558***
|
-0.564***
|
-0.560***
|
-0.515***
|
-0.557***
|
-0.563***
|
-0.559***
|
-0.514***
|
|
(0.0161)
|
(0.0160)
|
(0.0163)
|
(0.0175)
|
(0.0162)
|
(0.0161)
|
(0.0163)
|
(0.0175)
|
(0.0160)
|
(0.0160)
|
(0.0163)
|
(0.0175)
|
|
45-49
|
-0.570***
|
-0.575***
|
-0.571***
|
-0.527***
|
-0.571***
|
-0.576***
|
-0.573***
|
-0.528***
|
-0.569***
|
-0.576***
|
-0.572***
|
-0.528***
|
|
(0.0160)
|
(0.0160)
|
(0.0163)
|
(0.0175)
|
(0.0161)
|
(0.0160)
|
(0.0163)
|
(0.0175)
|
(0.0159)
|
(0.0160)
|
(0.0162)
|
(0.0174)
|
|
50-54
|
-0.585***
|
-0.590***
|
-0.586***
|
-0.540***
|
-0.586***
|
-0.591***
|
-0.587***
|
-0.541***
|
-0.584***
|
-0.590***
|
-0.587***
|
-0.541***
|
|
(0.0160)
|
(0.0160)
|
(0.0162)
|
(0.0174)
|
(0.0161)
|
(0.0160)
|
(0.0163)
|
(0.0175)
|
(0.0159)
|
(0.0160)
|
(0.0162)
|
(0.0174)
|
|
55-59
|
-0.595***
|
-0.600***
|
-0.597***
|
-0.550***
|
-0.596***
|
-0.602***
|
-0.598***
|
-0.551***
|
-0.594***
|
-0.601***
|
-0.598***
|
-0.551***
|
|
(0.0160)
|
(0.0160)
|
(0.0162)
|
(0.0175)
|
(0.0161)
|
(0.0160)
|
(0.0163)
|
(0.0175)
|
(0.0159)
|
(0.0160)
|
(0.0162)
|
(0.0174)
|
|
60-64
|
-0.605***
|
-0.610***
|
-0.607***
|
-0.566***
|
-0.605***
|
-0.612***
|
-0.609***
|
-0.567***
|
-0.604***
|
-0.611***
|
-0.608***
|
-0.567***
|
|
(0.0162)
|
(0.0162)
|
(0.0164)
|
(0.0176)
|
(0.0163)
|
(0.0162)
|
(0.0164)
|
(0.0176)
|
(0.0161)
|
(0.0162)
|
(0.0164)
|
(0.0176)
|
|
Females
|
0.0176***
|
0.0175***
|
0.0190***
|
0.0135***
|
0.0176***
|
0.0175***
|
0.0190***
|
0.0136***
|
0.0176***
|
0.0174***
|
0.0190***
|
0.0136***
|
|
(0.00229)
|
(0.00229)
|
(0.00228)
|
(0.00246)
|
(0.00229)
|
(0.00229)
|
(0.00228)
|
(0.00246)
|
(0.00229)
|
(0.00229)
|
(0.00229)
|
(0.00246)
|
|
Married or
cohabiting
|
-0.0444***
|
-0.0436***
|
-0.0452***
|
-0.0389***
|
-0.0448***
|
-0.0436***
|
-0.0452***
|
-0.0389***
|
-0.0443***
|
-0.0434***
|
-0.0450***
|
-0.0388***
|
|
(0.00262)
|
(0.00261)
|
(0.00261)
|
(0.00252)
|
(0.00262)
|
(0.00261)
|
(0.00261)
|
(0.00252)
|
(0.00262)
|
(0.00261)
|
(0.00261)
|
(0.00252)
|
|
Foreign-born
|
0.0326***
|
0.0330***
|
0.0357***
|
0.0242***
|
0.0330***
|
0.0333***
|
0.0360***
|
0.0243***
|
0.0324***
|
0.0331***
|
0.0357***
|
0.0242***
|
|
(0.00373)
|
(0.00373)
|
(0.00376)
|
(0.00362)
|
(0.00373)
|
(0.00373)
|
(0.00376)
|
(0.00362)
|
(0.00373)
|
(0.00373)
|
(0.00376)
|
(0.00362)
|
|
Low skilled
(ref.)
|
|
|
|
|
|
|
|
|
|
|
|
|
|
Medium skilled
|
-0.0884***
|
-0.0897***
|
-0.0874***
|
-0.0341***
|
-0.0880***
|
-0.0899***
|
-0.0875***
|
-0.0342***
|
-0.0871***
|
-0.0897***
|
-0.0875***
|
-0.0342***
|
|
(0.00485)
|
(0.00487)
|
(0.00491)
|
(0.00427)
|
(0.00485)
|
(0.00487)
|
(0.00491)
|
(0.00427)
|
(0.00484)
|
(0.00487)
|
(0.00492)
|
(0.00427)
|
|
High skilled
|
-0.110***
|
-0.112***
|
-0.105***
|
0.00294
|
-0.110***
|
-0.112***
|
-0.105***
|
0.00276
|
-0.108***
|
-0.112***
|
-0.105***
|
0.00300
|
|
(0.00508)
|
(0.00509)
|
(0.00523)
|
(0.00628)
|
(0.00507)
|
(0.00509)
|
(0.00523)
|
(0.00628)
|
(0.00507)
|
(0.00509)
|
(0.00523)
|
(0.00629)
|
|
|
|
|
|
|
|
|
|
|
|
|
|
|
|
|
|
|
|
|
|
|
|
|
|
|
|
|
|
|
|
|
|
|
|
|
|
|
|
|
|
|
|
Urbanisation
dummy
|
no
|
no
|
-0.00796***
|
-0.00525**
|
no
|
no
|
-0.00852***
|
-0.00567**
|
no
|
no
|
-0.00777***
|
-0.00511**
|
|
|
|
(0.00243)
|
(0.00236)
|
|
|
(0.00242)
|
(0.00236)
|
|
|
(0.00242)
|
(0.00236)
|
|
Time trend
|
no
|
yes
|
yes
|
yes
|
no
|
yes
|
yes
|
yes
|
no
|
yes
|
yes
|
yes
|
|
GDP growth rate
(qoq)
|
no
|
yes
|
yes
|
yes
|
no
|
yes
|
yes
|
yes
|
no
|
yes
|
yes
|
yes
|
|
Regional dummies
|
no
|
no
|
yes
|
yes
|
no
|
no
|
yes
|
yes
|
no
|
no
|
yes
|
yes
|
|
Firm-level
variables
|
no
|
no
|
no
|
yes
|
no
|
no
|
no
|
yes
|
no
|
no
|
no
|
yes
|
|
Observations
|
120,666
|
120,662
|
120,662
|
118,433
|
120,666
|
120,662
|
120,662
|
118,433
|
120,666
|
120,662
|
120,662
|
118,433
|
|
Log likelihood
|
-5.533e06
|
-5.527e06
|
-5.479e06
|
-5.130 e06
|
-5.542e06
|
-5.530e06
|
-5.482e06
|
-5.132e06
|
-5.541e06
|
-5.528e06
|
-5.480e06
|
-5.13 e06
|
|
chi2
|
10142
|
10211
|
10578
|
11657
|
10025
|
10161
|
10536
|
11629
|
10114
|
10218
|
10584
|
11658
|
|
p
|
0
|
0
|
0
|
0
|
0
|
0
|
0
|
0
|
0
|
0
|
0
|
0
|
|
r2_p
|
0.129
|
0.130
|
0.138
|
0.157
|
0.127
|
0.129
|
0.137
|
0.157
|
0.128
|
0.130
|
0.137
|
0.157
|
Notes: More detailed information on probit regressions, including other model specifications, is available upon request. Robust standard errors in parentheses. ***p<0.01, ** p<0.05, * p<0.1. Source: Author’s calculation based on Croatian LFS.
|
Marginal effects
|
Both reform variables
|
Cumulative effect
|
Only EPR reform
|
|
(1)
|
(2)
|
(3)
|
(1)
|
(2)
|
(3)
|
(1)
|
(2)
|
(3)
|
|
EPT liberalisation
(2013m6-2014m6)
|
-0.0278***
|
0.000621
|
-0.00152
|
|
|
|
|
|
|
|
(0.00430)
|
(0.00533)
|
(0.00536)
|
|
|
|
|
|
|
|
EPR liberalisation
(2014m7-2017m12)
|
0.0189***
|
0.0660***
|
0.0676***
|
|
|
|
0.0230***
|
0.0656***
|
0.0686***
|
|
(0.00279)
|
(0.00582)
|
(0.00586)
|
|
|
|
(0.00273)
|
(0.00468)
|
(0.00472)
|
|
Both reforms
(2013m6-2017m12)
|
|
|
|
0.00702***
|
0.0248***
|
0.0240***
|
|
|
|
|
|
|
|
(0.00255)
|
(0.00504)
|
(0.00508)
|
|
|
|
|
Age: 15-19
(ref.)
|
|
|
|
|
|
|
|
|
|
|
20-24
|
0.247***
|
0.248***
|
0.241***
|
0.247***
|
0.247***
|
0.241***
|
0.247***
|
0.248***
|
0.241***
|
|
(0.0110)
|
(0.0109)
|
(0.0110)
|
(0.0110)
|
(0.0110)
|
(0.0110)
|
(0.0110)
|
(0.0109)
|
(0.0110)
|
|
25-29
|
0.322***
|
0.323***
|
0.306***
|
0.321***
|
0.322***
|
0.305***
|
0.322***
|
0.323***
|
0.306***
|
|
(0.0107)
|
(0.0107)
|
(0.0107)
|
(0.0107)
|
(0.0107)
|
(0.0108)
|
(0.0107)
|
(0.0107)
|
(0.0107)
|
|
30-34
|
0.338***
|
0.339***
|
0.317***
|
0.337***
|
0.338***
|
0.315***
|
0.338***
|
0.339***
|
0.317***
|
|
(0.0108)
|
(0.0108)
|
(0.0109)
|
(0.0108)
|
(0.0108)
|
(0.0109)
|
(0.0108)
|
(0.0108)
|
(0.0109)
|
|
35-39
|
0.334***
|
0.336***
|
0.310***
|
0.334***
|
0.335***
|
0.309***
|
0.334***
|
0.336***
|
0.310***
|
|
(0.0108)
|
(0.0108)
|
(0.0109)
|
(0.0108)
|
(0.0108)
|
(0.0110)
|
(0.0108)
|
(0.0108)
|
(0.0109)
|
|
40-44
|
0.338***
|
0.340***
|
0.315***
|
0.338***
|
0.339***
|
0.314***
|
0.338***
|
0.339***
|
0.315***
|
|
(0.0108)
|
(0.0108)
|
(0.0109)
|
(0.0108)
|
(0.0108)
|
(0.0109)
|
(0.0108)
|
(0.0108)
|
(0.0109)
|
|
45-49
|
0.328***
|
0.329***
|
0.305***
|
0.327***
|
0.328***
|
0.304***
|
0.328***
|
0.329***
|
0.305***
|
|
(0.0108)
|
(0.0108)
|
(0.0109)
|
(0.0108)
|
(0.0108)
|
(0.0109)
|
(0.0108)
|
(0.0108)
|
(0.0109)
|
|
50-54
|
0.316***
|
0.318***
|
0.291***
|
0.316***
|
0.317***
|
0.290***
|
0.316***
|
0.318***
|
0.291***
|
|
(0.0108)
|
(0.0108)
|
(0.0110)
|
(0.0108)
|
(0.0108)
|
(0.0110)
|
(0.0108)
|
(0.0108)
|
(0.0110)
|
|
55-59
|
0.274***
|
0.277***
|
0.250***
|
0.274***
|
0.275***
|
0.249***
|
0.274***
|
0.277***
|
0.250***
|
|
(0.0111)
|
(0.0111)
|
(0.0112)
|
(0.0111)
|
(0.0111)
|
(0.0112)
|
(0.0111)
|
(0.0111)
|
(0.0112)
|
|
60-64
|
0.185***
|
0.188***
|
0.161***
|
0.186***
|
0.187***
|
0.160***
|
0.185***
|
0.188***
|
0.161***
|
|
(0.0120)
|
(0.0120)
|
(0.0121)
|
(0.0120)
|
(0.0120)
|
(0.0121)
|
(0.0120)
|
(0.0120)
|
(0.0121)
|
|
Females
|
0.0157***
|
0.0158***
|
0.0131***
|
0.0157***
|
0.0158***
|
0.0131***
|
0.0157***
|
0.0158***
|
0.0131***
|
|
(0.00251)
|
(0.00251)
|
(0.00252)
|
(0.00251)
|
(0.00251)
|
(0.00252)
|
(0.00251)
|
(0.00251)
|
(0.00252)
|
|
Married or
cohabiting
|
0.0229***
|
0.0220***
|
0.0280***
|
0.0226***
|
0.0222***
|
0.0282***
|
0.0229***
|
0.0220***
|
0.0280***
|
|
(0.00305)
|
(0.00305)
|
(0.00306)
|
(0.00305)
|
(0.00305)
|
(0.00307)
|
(0.00305)
|
(0.00305)
|
(0.00306)
|
|
Foreign-born
|
-0.0195***
|
-0.0198***
|
-0.0269***
|
-0.0192***
|
-0.0192***
|
-0.0262***
|
-0.0195***
|
-0.0198***
|
-0.0269***
|
|
(0.00414)
|
(0.00414)
|
(0.00419)
|
(0.00414)
|
(0.00414)
|
(0.00419)
|
(0.00414)
|
(0.00414)
|
(0.00419)
|
|
Low skilled
(ref.)
|
|
|
|
|
|
|
|
|
|
|
Medium skilled
|
0.223***
|
0.224***
|
0.197***
|
0.223***
|
0.224***
|
0.197***
|
0.222***
|
0.224***
|
0.197***
|
|
(0.00398)
|
(0.00399)
|
(0.00407)
|
(0.00398)
|
(0.00398)
|
(0.00407)
|
(0.00398)
|
(0.00399)
|
(0.00407)
|
|
High skilled
|
0.301***
|
0.303***
|
0.260***
|
0.302***
|
0.302***
|
0.260***
|
0.299***
|
0.303***
|
0.260***
|
|
(0.00435)
|
(0.00436)
|
(0.00461)
|
(0.00435)
|
(0.00435)
|
(0.00461)
|
(0.00435)
|
(0.00436)
|
(0.00461)
|
|
|
|
|
|
|
|
|
|
|
|
|
Urbanisation
dummy
|
no
|
no
|
0.0529***
|
no
|
no
|
0.0511***
|
no
|
no
|
0.0529***
|
|
|
(0.00266)
|
|
|
(0.00265)
|
|
|
(0.00266)
|
|
Time trend
|
no
|
yes
|
yes
|
no
|
yes
|
yes
|
no
|
yes
|
yes
|
|
GDP growth rate
(qoq)
|
no
|
yes
|
yes
|
no
|
yes
|
yes
|
no
|
yes
|
yes
|
|
Regional dummies
|
no
|
no
|
yes
|
no
|
no
|
yes
|
no
|
no
|
yes
|
|
Firm-level
variables
|
no
|
no
|
no
|
no
|
no
|
no
|
no
|
no
|
no
|
|
Observations
|
171,113
|
171,108
|
171,108
|
171,113
|
171,108
|
171,108
|
171,113
|
171,108
|
171,108
|
|
Log likelihood
|
-1.150e07
|
-1.150e07
|
-1.140e07
|
-1.150e07
|
-1.150e07
|
-1.140e07
|
-1.150e07
|
-1.150e07
|
-1.140e07
|
|
chi2
|
7661
|
7777
|
9164
|
7568
|
7602
|
8938
|
7618
|
7776
|
9163
|
|
p
|
0
|
0
|
0
|
0
|
0
|
0
|
0
|
0
|
0
|
|
r2_p
|
0.0469
|
0.0475
|
0.0578
|
0.0462
|
0.0464
|
0.0566
|
0.0466
|
0.0475
|
0.0578
|
Notes: Employment share includes only employees (15-64) and not self-employed persons and family workers. More detailed information on probit regressions, including other model specifications, is available upon request. Robust standard errors in parentheses. *** p<0.01, ** p<0.05, * p<0.1. Source: Author’s calculation based on Croatian LFS.
Notes: Results are from linear probability model with robust standard errors. Employment share includes only employees (15-64) and not self-employed persons and family workers. Monthly data are extracted from yearly datasets. Regressions control for basic set of individual characteristics, i.e., age dummies, gender, marriage status and nativity plus time trend and quarterly GDP growth rate. Other model specifications – such as those additionally including education, region and level of urbanisation – are also tested and the results are more-or-less the same (available upon request). Source: Author’s calculation based on Croatian LFS.
|
|
|
Abstract
This paper examines the effects of employment protection legislation (EPL) reforms on employment outcomes in Croatia, testing the available theoretical predictions of partial labour market reforms from the literature. With a push from the EU accession, the reforms liberalised employment protection provisions for both temporary (2013) and permanent (2014) contracts at the end of the six-year long recession thus presenting a distinctive case for policy evaluation. Using Labour Force Survey (LFS) data in the period 2007-2017 and applying the event study method in combination with probit regressions, the main results suggest that EPL reforms from 2013 and 2014 induced a rise in temporary employment, while the effects on overall employment are clearly visible only in the case of the second reform. Moreover, probit regression estimations show that specific groups of the population – females, youths, foreigners, the low-skilled and singles from rural areas – have a higher probability of ending up with temporary contracts, suggesting there is a segmentation on the Croatian labour market.
Keywords: employment protection; reform; recession; temporary employment; policy evaluation; Croatia
JEL: J21, J88, D04, C35
1 Introduction
Easing of employment protection has long been advocated as a way to combat high unemployment, especially at the European level. However, empirical evidence on the effects of labour marker flexibilisation on increasing overall employment is not very convincing. One of the reasons for this might be that flexibilization or liberalisation of labour market legislation has occurred only at the margin, that is, most of the employment protection reforms eased restrictions on the use of temporary contracts while restrictions regarding permanent contracts remained unchanged. This led to distortions on the labour market by encouraging employers to substitute temporary for permanent workers thus creating the so-called dual labour market.
Although temporary contracts are often seen as a natural way of entering the labour market – or as a stepping-stone to permanent employment – and a way to stimulate job creation and reduce unemployment, both theoretical and empirical literature have shown that this is not necessarily the case, but instead that temporary are often substituted for permanent contracts thus increasing worker turnover and possibly even causing a rise in non-employment (Blanchard and Landier,  2002 2002; Kahn, 2010; Sala, Silva and Toledo, 2012; Tejada, 2017). In addition, a higher incidence of temporary employment also seems to reduce labour productivity and aggregate welfare (Blanchard and Landier, 2002; Cahuc and Postel-Vinay, 2002; Cahuc, Charlot and Malherbet, 2016; Hijzen, Mondauto and Scarpetta, 2017). On the other hand, the literature has clearly shown that some specific groups of workers – including women, young, less educated, and less-skilled workers – are more often employed on temporary contracts (Kahn, 2007). It has also been shown that temporary jobs are lower paid and offer less on-the-job training, while those working on these jobs are in principle less satisfied (Blanchard and Landier, 2002; Booth, Francesconi and Frank, 2002a; Barbieri and Cutuli, 2018).
There is ample evidence of distorting effects of partial or two-tier labour market reforms for more advanced countries; however, empirical analysis for Eastern European and other emerging market countries is still rather scarce. This is especially true in the case of the newest EU member state – Croatia. Even though there are some works that categorize the Croatian labour market as dual (e.g., Franičević, 2011; Brkić, 2015), and even some that try to assess the impact of employment protection legislation (EPL) on labour market outcomes empirically (Tomić and Domadenik, 2012; Matković, 2013), no sound analysis of the direct impact of recent labour market legislation reforms on the Croatian labour market is available. Accordingly, this paper aims to discover possible effects that employment protection legislation reforms have had on labour market outcomes in Croatia. By applying probability regression models and the event study approach to micro data from the Croatian Labour Force Survey (LFS) in the period 2007-2017 it seeks to show whether the EPL reforms from 2013 and 2014 increased the incidence of temporary employment that occurred after that. Given that the reforms might have actually been completely exogenously determined by the need to harmonise Croatian labour market regulations with those of the EU, they do present a distinctive case for policy evaluation. As both reforms were aimed at flexibilisation of the employment protection, their effects on the overall employment are also investigated.
Croatia presents an interesting case to study for several reasons. First, EPL in Croatia has been considered as overly rigid for most of the post-transition period, often being blamed for the rather sluggish labour market. Second, the recession in Croatia lasted for six full years and revealed many weaknesses of the labour market, including downward wage rigidity as the labour market crisis adjustment was mainly effectuated through cuts in employment. Third, EU accession happened in the midst of the recession, and actually led to changes in, among other things, labour legislation. In June 2013 temporary contracts and provisions regulating collective dismissals were liberalized, while in July 2014 a new law liberalized the provisions on permanent contracts. Finally, other features of the Croatian economy, such as its seasonal character or the high importance of the public sector, make an investigation of the impact of employment protection legislation changes on labour market outcomes additionally worthwhile.
There are several contributions of this paper. Firstly, available theoretical predictions of the impact of two-tier labour market reforms on labour market outcomes are empirically tested on a new country case that has some specific features not available in previous studies. Secondly, to the best of my knowledge, this is the first time the event study method is being applied to analyse the impact of EPL reform on labour market outcomes. Event study models are more frequently used in financial econometrics and only recently does applied microeconometrics literature seem to be taking this approach in analysing policy reform effects on labour market and welfare outcomes (e.g., Simon, 2016; Fuest, Peichl and Siegloch, 2018; Perez-Truglia, 2019) - not, however, in the studies on EPL reforms. Further, as evidencebased policy is notable for its absence in Croatia and given that with the EU accession numerous legal provisions needed to be changed, this paper provides a valuable contribution to the national policy evaluation literature. Finally, since EU accession not only coincided with the reforms, but served as a ‘push factor’ to enact the labour legislation liberalisation, lessons learned in the case of Croatia might be valuable for candidate and future accession countries as well.
The rest of the paper is organised as follows. The next section briefly reviews relevant studies in the literature covering the main issues related to the effects of labour legislation – and especially partial employment protection legislation reforms – on labour market outcomes at the European level. This section also touches upon some of the works related to segmentation on the Croatian labour market, while the section after that describes the labour market and institutional context in Croatia more thoroughly, concentrating particularly on the period between 2007 and 2017. Section four provides a description of the data used and the main empirical strategy, discussing possible shortcomings and ways to deal with them while drawing on the findings from the literature. The fifth section presents the main results, including the event study analysis but also probability regression (probit) estimations with sensitivity analyses that assess several different model specifications in order to further discuss the results obtained and to test the robustness of the presented estimations. Finally, the concluding section provides a brief summary of the main findings and goes on to discuss some of the limitations of the paper, with suggestions for future work.
2 Related literature
The impact of employment protection on labour market outcomes has attracted a lot of attention in the economic literature. Earlier studies actually put rigid employment protection at the forefront of the reasons for high unemployment in Europe, especially in comparison with the US (e.g., Nickell, 1997 or Siebert, 1997). However, the negative effects of rigid EPL on (un)employment have never been entirely confirmed in the literature (Piton and Rycx, 2018; Bentolila, Dolado and Jimeno, 2019) since strict employment protection not only reduces the job destruction rate, but it also – because of expected future firing costs – decreases the job creation rate, thus possibly not changing or even increasing unemployment levels. Nevertheless, many European countries have tried to boost their labour markets by liberalising their labour legislation.
However, most countries approached the problem of high unemployment and rigid labour legislation by relaxing only those provisions related to temporary employment while restrictions regarding permanent contracts remained mostly unchanged (Bentolila, Dolado and Jimeno, 2019), i.e., European countries have conducted reform ‘at the margin’ or they have introduced what is called ‘selective flexibilisation’ (Blossfeld et al., 2012; Barbieri and Cutuli, 2015). This has produced divisions between labour market insiders and outsiders (Eichhorst and Marx, 2019), but it has also introduced additional distortions on the European labour markets, including higher job turnover, loss of productivity and, as expected, higher incidence of temporary employment, while the effect on reducing unemployment has not been confirmed. Therefore, some more recent studies (e.g., Boeri, 2011 or Centeno and Novo, 2012), emphasize that it is not the EPL as such that is the main issue for European labour markets anymore; it is the two-tier or dual labour market that has arisen as a consequence of the partial employment protection reforms 1.
A number of works in the literature in the past two decades developed theoretical models that help in explaining labour market outcomes of the partial EPL reforms. These include, among others, articles by Blanchard and Landier ( 2002), Cahuc and Postel-Vinay ( 2002), Boeri and Garibaldi ( 2007), Sala, Silva and Toledo ( 2012), Cahuc, Charlot and Malherbet ( 2016) and Tejada ( 2017), while Bentolila, Dolado and Jimeno ( 2019) recently provided a nice overview of both theoretical and empirical findings. Blanchard and Landier ( 2002), for example – in the case of temporary contracts liberalisation without any change in the costs for regular jobs – predict two main effects: firms will be more likely to hire new workers on temporary contracts to learn about their productivity but they will also be less likely to keep them in regular jobs. They test the model on the French data for young workers and show that the reforms have increased turnover, without a significant reduction in unemployment duration, while the effect on welfare appears to have been negative (Blanchard and Landier, 2002). The Cahuc and Postel-Vinay ( 2002) matching model suggests that the higher the firing costs, the lower the share of temporary jobs transformed into permanent jobs, thus increasing unemployment and reducing aggregate welfare.
Empirical studies of the partial EPL reforms differ in having either a macro or a micro approach, but also in conducting multi-country or single-country analyses. For example, Kahn ( 2007; 2010) argues that a micro-approach is more appropriate in this context and provides important empirical findings in a multi-country environment. In his 2007 paper, he finds that more stringent EPL (for permanent contracts) for seven advanced economies increases relative non-employment rates for youth, immigrants, and women, whereas it also increases the incidence of temporary employment for the low-skilled, youth, and both native and especially immigrant women (Kahn, 2007). In Kahn ( 2010), the author finds that policies making it easier to create temporary jobs on average raise the likelihood that workers will be in temporary jobs by encouraging a substitution of temporary for permanent work in a sample of nine European countries. On the other hand, there is some evidence in his work that reducing restrictions (costs) on permanent contracts can have a positive impact on increasing employment or at least decreasing the risk of temporary employment (Kahn, 2010).
Though valuable, multi-country studies often cannot discriminate among some country-specific factors or establish a valid control group (Fuest, Peichl and Siegloch, 2018), and thus single-country articles that focus on partial EPL reforms have increasingly emerged in recent years. These include, for example, Centeno and Novo ( 2012) for Portugal, Messe and Rouland (2014) for France, Vodopivec, Laporsek nad Vodopivec ( 2016) for Slovenia, and Hijzen, Mondauto and Scarpetta ( 2017) for Italy. In an analysis of the Portuguese labour legislation reform from 2004, Centeno and Novo ( 2012) find that the share of fixed-term contracts, along with excess turnover, has increased in firms with 11 to 20 workers as the reform increased the protection of open-ended employment for workers in those firms. Given the different levels of protection for workers of different ages in France, i.e., protection being more stringent for firms laying off workers aged over 50, Messe and Rouland (2014) analyse the effects of age-specific employment protection reform from 1999 – which increased the costs only for large firms – and find a substantial positive effect of the reform on firms’ incentives to provide training. Vodopivec, Laporsek nad Vodopivec ( 2016) find that the 2013 reform in Slovenia – which increased the protection of fixed-term contracts while it decreased the protection of permanent contracts – reduced segmentation on the Slovenian labour market and also increased the probability of permanent employment. Similar to Messe and Rouland’s (2014) study for France, Hijzen, Mondauto and Scarpetta ( 2017) explore different levels of employment protection related to firm size on temporary employment in Italy and find that stronger employment protection in larger firms increases worker turnover as well as the incidence of temporary employment, while it tends to reduce labour productivity.
Segmentation or duality of the Croatian labour market has been discussed in the literature for quite some time; however, mostly at a descriptive level (e.g., Račić, Babić and Podrug, 2005; Franičević, 2011; or Brkić, 2015). Nevertheless, there have been two attempts to empirically test the effects of (rigid) labour legislation on labour market outcomes in Croatia. The first is the paper by Tomić and Domadenik ( 2012) in which the authors show that in the period 1996-2006 there was an adverse selection on the Croatian labour market due to high dismissal costs; however, they also show that educational attainment is of greater relevance for employment and conclude that the impact of firing costs on employment probabilities decreased after the legislative reform in 2003. In the second paper, Matković ( 2013) examines the “flexicurity” concept in the context of regulatory changes introduced in the early 2000s and suggests that the growth of fixed-term employment slowed and positioned Croatia just below the EU average after the reforms. Additional empirical analysis indicates that the incidence of temporary employment falls mostly on low-skilled and low-paid jobs (Matković, 2013). The present paper tries to fill in the gap in the literature on the impact of EPL on labour market outcomes in Croatia by empirically testing the theoretical propositions of (partial) labour legislation reform set out in the literature.
3 Croatia: labour market and institutional setting
After the turbulent 1990s, the Croatian labour market finally stabilized in the first half of the 2000s. However, the global financial and economic crisis revealed all the weaknesses of the Croatian economy. Although it began only in 2009 in Croatia, the recession lasted for six full years with enormous consequences for the labour market (Figure 1). The employment level fell strongly, with some evidence (World Bank, 2010; Franičević, 2011) suggesting that in the early stages this was mainly done through temporary contracts2. Vukšić (2014) further emphasizes that labour market adjustment in the crisis happened through cuts in employment in the private sector3, primarily in male-dominated sectors, with decreasing share of youth employment but the rising significance of temporary and part-time employment after 2011.
Figure 1Employment and temporary employment for the population aged 15-64 – Croatia and the EU DISPLAY Figure
While the economy started to recover at the end of 2014 employment levels are still well below those in 2007/20084. On the other hand, the share of temporary employment among employees has risen to new record levels of over 20% in 2017 in comparison to about 12-14% in the pre-crisis and (early) crisis period, while the incidence of precarious employment (“contracts up to three months”) has been the highest among EU countries ever since 2013 (7.1% of all employees in 2017). Interestingly, although the literature predicts an increase of temporary contracts during a recession (Kahn, 2010), such contracts were much more in evidence with the start of the recovery in Croatia. At the same time, the average share of self-employed persons, 19% in the pre-crisis and early crisis period (2007-2011), stood at only 11% in 2017 (Figure 2). This indicates that the patterns of employment have somewhat changed in the aftermath of the recession in Croatia (Figure 1).
At the same time, during most of the post-transition period Croatian labour legislation has been considered to be particularly rigid, and is often denounced as the main culprit for the bad situation on the labour market (Rutkowski, 2003; Tomić and Domadenik, 2012). Although with the amendments to the law introduced in 2003 labour legislation in Croatia was somewhat liberalised, the overall employment protection legislation (EPL) index remained above the EU and OECD average (Matković and Biondić, 2003). The new labour act enacted in 2009 did not bring any substantial changes in ‘flexibilisation’ provisions, i.e., the EPL index remained unchanged (Tomić, 2013; Potočnjak, 2014).
However, EU accession in July 2013 brought to two new reforms of labour legislation in a short amount of time. Amendments to the existing Labour Act that introduced liberalisation of employment protection for temporary contracts (EPT) and employment protection against collective dismissals (EPC) were introduced in June 2013 5, the main purpose being not only to increase labour market flexibility but actually to harmonise the Croatian labour market regulations with those of the EU (Kunovac, 2014; Potočnjak, 2014). Part of legislation regarding regular contracts (EPR) has been left unchanged in this instance 6. However, as soon as in the following year (July 2014) 7 the passage of a new Labour Act was enforced by the need to further harmonise the national legislation with that in the EU (Potočnjak, 2014). This act introduced liberalisation of employment protection for regular contracts (EPR) 8 and further liberalisation of employment protection against collective dismissals (EPC). Employment protection index for temporary contracts (EPT) has been left unchanged on this occasion, despite some changes regarding liberalisation in the area of temporary employment agencies 9.
Table 1 sums up the recent employment protection legislation changes using the OECD’s indicators for employment protection for regular contracts, collective dismissals and temporary contracts 10. Although some of the new provisions did induce changes in the relevant indices, the general impression has been that the scope of the reforms implemented is rather limited, thus the need for labour market reform has remained (CNB, 2014; Potočnjak, 2014).
Table 1EPL reforms in Croatia DISPLAY Table
Therefore, labour legislation liberalisation, though advocated by the business community and many experts in the field for quite some time, happened in parallel with (a ‘push’ from) the EU accession, but also at the end of the six-year long recession and some other policy reforms that might have influenced the employment patterns; for example, vocational training without commencing employment for youth population 11 or seasonal employment in agriculture via vouchers 12. In addition, as of 2015 there is the possibility for an employer who hires a young person up to the age of 30 on a permanent (open-ended) contract to be exempted from paying employer’s contributions for up to five years 13. In the following sections I will try to determine if and how employment protection legislation changes actually affected labour market outcomes in Croatia.
4 Methodology and data
4.1 Methods
Since the main research question of this paper examines the effect of employment protection reform(s) on the incidence of temporary employment and overall level of employment, the natural approach would be to use some of the standard policy evaluation methods, such as differences-in-differences or some of the matching methods. However, as the policy reforms are all-encompassing in this case, i.e., changes in labour legislation provisions have a potential effect not only for the employed population but for the entire population that might get employment; the identification of the credible treatment group is somewhat difficult. Similarly, if one would like to apply some other impact evaluation method such as regression discontinuity design (RDD) it would need to have the treatment or running variable, which in this case is time; yet again, this is not unique for a person but instead applies to all potential participants on the labour market. Still, the effects of the employment protection reform(s) on the incidence of temporary employment might be viewed as an intention-to-treat (ITT) case, as the reform represents a treatment offer even if it doesn’t lead to temporary contracts in all cases.
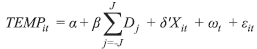
In order to avoid the aforementioned issues, this paper relies on a somewhat different approach in analysing the effects of labour legislation reforms on employment outcomes in Croatia. That is, I adapt models used in the works by Kahn (2007; 2010), which apply different probability models in the investigation of the effects of EPL reforms on employment in a multi-country environment. In essence, the following models are being estimated:| TEMPit = α + β * EPL_reform + δ'Xit + ωt + εit | (1.1) |
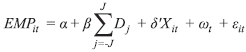
| EMPit = α + β * EPL_reform + δ'Xit + ωt + εit | (1.2) |
where TEMPit is a dummy variable indicating that a person i is employed on a temporary contract in month t and EMPit is a dummy variable if a person i is employed (an employee) in month t. EPL_reform indicates a reform variable, which is added to the basic set of covariates ( Xit) to take into account the EPL reforms from 2013 and 2014, while ωit represents time effect.
Essentially, the determinants of being employed (an employee) and temporarily employed (eq. 1 and 2) are estimated in a set of probit (a maximum likelihood estimator) regressions, i.e.,
| Pr(Yit = 1) = Pr(α + β * EPL_reform + δ'Xit + ωt + εit ≥ 0) = Φ(α + β* EPL_reform + δ'Xit + ωt) | (2) |
where Yi is an outcome equal to 1 if a person is a temporary employee, Xi presents a set of individual, household, area and job characteristics 14, Φ is a standard normal cumulative distribution function which translates discrete values of Yi* (individual’s underlying probability for employment/temporary employment status, which is an unobserved (latent) variable) to a probability ( Pr) for observing the event Yi = 1 given covariates, and β is the main parameter of interest 15.
Besides the set of individual, household and area characteristics I add reform variables in the model for both temporary and permanent contracts. One way to account for labour legislation reforms is to include the value of the OECD’s employment protection legislation indices (Table 1) in different time-periods (as in Kahn, 2007), while the other possibility is to simply include dummy variables for the period when reforms were in place (as in Kahn, 2010). Given that the literature suggests that what affects the incidence of temporary employment is the rigidity of the protection of permanent employment relative to that of temporary and not the temporary (or permanent) protection legislation itself (Blanchard and Landier, 2002; Kahn, 2010; Bentolila, Dolado and Jimeno, 2019), I estimate the models having both temporary and permanent reform variables in the same specification. However, models including only one of the reform (dummy) variables are also estimated, having in mind that the second reform (EPR from July 2014) happened on top of the first one (EPT from June 2013). I additionally account for the possible endogeneity of the EPL reforms by adding time trend, regional dummies and quarterly GDP growth rates in the model. This should also control for the state of the economy 16.
In order to establish a flat pre-reform trend, i.e., constant probability of temporary employment before the reform(s), I apply the event study in this paper. Although this method is more commonly used in financial econometrics, i.e., in estimating the impact of an event on the value of a firm, it has also been used recently in applied microeconometrics analysing different aspects of (policy) reform on labour market and welfare outcomes (e.g., Simon, 2016; Fuest, Peichl and Siegloch, 2018; Perez-Truglia, 2019), but not, to the best of my knowledge, in any estimation of the effects of labour legislation reform on labour market outcomes. In principle, event time dummies replace the treatment variable in the regression model. This would mean that I estimate the equation (1.1) or (1.2) where instead of the reform variable ( EPL_reform) I have a set of dummy variables indicating number of periods away (before and after) from a labour legislation reform (an event), or:
 | (3.1) |
 | (3.2) |
where ![]() ![]() ![]() ![]() ![]() ![]()  ![]() is a vector of dichotomous indicators each of which is equal to one when an observation is j periods away from some discrete policy event (Simon, 2016), that is, from EPL policy reform (June 2013 or July 2014) in this case. If the incidence of temporary employment changed sharply around the time of the event (EPL reform) β parameters for the periods prior to the event should be equal (around) zero while β parameters for the periods after the event should be larger than zero. Accordingly, one would expect that the same parameters are equal to (around) zero for all j-periods (before and after) away from the reform in the case of some other outcome variable not affected by the EPL reform. I use the time (month and year) of the contract for each person in the sample in order to link the event to a specific person outcome and trace it back to 24 months (8 quarters) before the reform and 24 months (8 quarters) after the reform 17.
4.2 Data
Key information in this paper is taken from the Croatian Labour Force Survey (LFS) microdata in the period 2007-2017. Although set up as a “rotating panel” survey, the available data comprise essentially a repeated cross-section as no tracing of individuals over time is possible; however, the same questions are posed to a different sample of individuals each time, which means the samples can be compared over time. Besides detailed data on individuals’ labour market status, the LFS provides a rich set of information about different socio-demographic characteristics of both individuals and their respective households, as well as data on job and firm characteristics for those having a job. While the dataset is acquired on a yearly level it also provides the exact time (year, month, week) the survey is conducted and the exact timing (year, month) of the starting of the current job, thus enabling us to determine the incidence of (temporary) employment pre- and post-EPL reforms. Henceforth, information on a monthly basis extracted from a yearly dataset is used in my estimations, applying the appropriate population weights.
The dependent variable(s) follow standard ILO and Eurostat definitions of labour market status (Figure 1). This means that the focus is on employees as “individuals who work for a public or private employer and who in return receive compensation in the form of wages, salaries, fees, gratuities, payment by results or payment in kind”, and further to a subgroup of employees “whose main job will terminate either after a period fixed in advance, or after a period not known in advance, but nevertheless defined by objective criteria, such as the completion of an assignment or the period of absence of an employee temporarily replaced”. I exclude self-employed persons and family workers in the main part of the analysis, as is standard in the literature, given that their status is most likely driven by completely different factors than those of typical employees.
The above definition of temporary employment might seem too broad as it includes, apart from fixed-term contracts, different forms of seasonal and occasional work. The literature does not have a unanimous ruling on this. For example, Tejada ( 2017) analyses the wider definition of temporary employment in his work on Chilean data, which, besides fixed-term contracts, also includes other types of contingent jobs such as per task, per-service, and temporal (seasonal) jobs. He explains that this is important in the Chilean and other Latin American countries context due to the high importance of seasonal jobs. Kahn in both his 2007 and his 2010 paper discusses different definitions of temporary employment in the data he uses, i.e., International Adult Literacy Survey (IALS) (Kahn, 2007) and European Community Household Panel (ECHP) (Kahn, 2010), and the one provided by the OECD. In general, the OECD definition is closer to the one stated above 18, whereas Kahn ( 2007; 2010) conducted his analyses focusing on a narrower definition that covers only fixed-term contracts. However, he shows that results are qualitatively similar when using a broader definition of temporary employment (Kahn, 2010). Consequently, following the definition by the ILO and Eurostat, but also taking into account the (seasonal) character of the Croatian labour market 19 and the impact of globalisation and technology (digitalisation, platform economy), the analysis is focused on a broader definition of temporary employment.
An additional caveat regarding temporary employment based on (Croatian) LFS data is worth noting here. Namely, there has been a slight change in the definition of temporary employment in 2014 in a way that a portion of workers – working on service, author’s or student contract – was reclassified from self-employment to temporary (occasional) employment (Figure 2). Nonetheless, between 2013 and 2014 the share of workers in occasional jobs increased by 0.9 percentage points (from 0.5% to 1.4%) among the total number of employees, following a decrease of the trend during the crisis (with an average share of 1.1% in the period 2007-2017). It is evident, however, that this cannot be the sole reason for an increase of temporary employment by 2.4 percentage points in the same period (Figure 1) as occasional contracts constitute less than 4.5% on average of all temporary contracts in the period 2007-2017 (yet 7.5% after 2014). In addition, other data sources (CES and CBS) also point to a rise of temporary employment after 2013. All the same, I will also test the findings obtained on a narrower definition, i.e., fixed-term contracts only, but also on a broader definition of employment, i.e., overall employment that includes the self-employed.
Figure 2Composition of employment on the Croatian labour market (population aged 15-64) DISPLAY Figure
In estimating the effects of labour legislation reforms on employment outcomes, I rely on the rich set of LFS microdata using the core individual characteristics such as age (10 5-year age dummies), gender and nationality (if born outside of Croatia), but also marriage status and the level of education as covariates ( Xit). Although Kahn ( 2010) says that changes in education levels are endogenous with respect to employment status and thus does not include the level of education in estimating employment probabilities, I believe that education is an important determinant of both employment and temporary vs. permanent employment status and thus test the model with education variables as well. Additional control variables that are included in the estimations are regional residence and the level of urbanisation.
Although firm-level variables, such as industry or occupational structure, might be endogenous, i.e., can be affected by employment protection legislation (Kahn, 2007; 2010), I also estimate the models including firm characteristics such as the size of the firm, public vs. private sector and industry and occupational dummies. Namely, as stated elsewhere in the literature, inclusion of industry and occupation variables can help control for other factors affecting the incidence of temporary employment such as the reduction of adjustment costs (Boeri and Garibaldi, 2007). Basic descriptive statistics are presented in Table A1 in the Appendix. Even though it would be valuable to have some other covariates included in vector X (such as past (un)employment histories or individual fixed effects to control for individual ability), the list of controls is in line of the variables usually found in the literature.
5 Results
Figure 3 shows the incidence of employment – as a share of total employment and employees in the total working-age (15-64) population – and temporary employment – as a share of total temporary employees and only those on fixed-term contract in the total number of employees aged 15-64 – on a monthly level in the period 2007-2017, with indications of the months in which EPL reforms occurred. In essence, this figure represents a more detailed view of the indicators already presented in Figure 1. Although only descriptive, Figure 3 suggests there is a cut-off in the incidence of temporary employment at the time of labour legislation reform, more so in the case of June 2013 (liberalisation of temporary employment) than in the case of July 2014 (liberalisation of regular contracts). Disruption in the case of overall employment is not so obvious; there is a rise in employment after 2013 but no evident discontinuity. Furthermore, it seems that prior to EPL reforms the trend in the incidence of temporary employment was flat (although starting to increase before the first reform when focusing on fixed-term contracts only), while the trend in the employment rate was downward sloping (as expected in a recession). Although it is hard to make any strong conclusions without further analysis, this descriptive inspection would imply that liberalisation of the (temporary) employment protection in Croatia did not produce evident jump in overall employment; however, it did induce a rise in the number of temporary employment contracts suggesting that the new legislation possibly enabled the replacement of regular employment contracts by those of a temporary nature.
Figure 3Monthly shares of employment and temporary employment for the population aged 15-64 DISPLAY Figure
5.1 Event study
In order to further examine descriptive findings, I start with the graphical representation of the event study (eq. 3.1 and 3.2) in an attempt to test the assumption of there being no differential trends pre-reform, but also to show that there is a discrete impact of the EPL reform on the incidence of temporary employment on the Croatian labour market (Figure 4). As already mentioned, the date of the employment contract is used as time variable (to construct event dummies) and a window of eight quarters prior to the reform and eight quarters after the reform, evaluating separately reforms of employment protection for temporary contracts (June 2013 or q2 2013) and for regular contracts (July 2014 or q3 2014). Following Simon (2016), I apply a linear probability model, testing different sets of covariates in the model along with event dummies on both temporary employment and employee status.
As evidenced in the upper left part of Figure 4, almost all pre-treatment coefficients are close to zero and statistically insignificant while post-treatment coefficients are all larger than zero and statistically significant. This would suggest that the employment protection reform that liberalised temporary contracts (q2 2013) had a significant impact on the probability of temporary employment in Croatia. The liberalisation of employment protection of regular contracts (reform from the q3 2014), shown in the upper right panel, displays somewhat different results. There is a visible positive (and significant) post-reform trend; however, although close to zero, pre-reform coefficients are also statistically significant. As a result, one cannot say that this event (labour legislation reform in July 2014) had a significant discrete effect on the probability of temporary employment, at least not given the event study model results 20. However, this is not unexpected given the results for the 2013 reform as the positive post-reform effect of that event should be visible in the pre-reform period of the 2014 event (4 overlapping quarters), i.e. the reform in 2014 should be viewed as a cumulative effect on top of the previous (2013) reform.
In the lower part of Figure 4 the event study results for employment are shown: both in the 2013 and in the 2014 reform case the coefficients are close to zero and mostly non-significant indicating that labour legislation reforms did not affect the overall employment probability for new contracts. This is somewhat surprising as the actual goal of the reform was to increase overall employment; however, this result goes hand-in-hand with what was already established descriptively (Figure 3).
Although the presented exercise is here to establish no differential trends in the pre-reform period and potential discrete effect of the reform(s), it is worth mentioning its several potential shortcomings. First, when analysing the probability of employment, i.e., the probability of becoming an employee, the alternative in this case are only those employed (self-employed and family workers) given that only they have the information on the ‘start of the contract’. So, the variation in this case is limited. Another potential shortcoming is the potential bias of omitting the jobs that have expired in the meantime as this approach identifies only those contracts that last long enough to be recorded in some subsequent LFS survey. The more time has passed, the greater the bias. However, when estimating the same (event study) models with limitation on the tenure, very similar results are obtained: the size of the coefficients is somewhat smaller, but the trends and statistical significance are the same 21. In the next section I present more detailed results on the determinants of both temporary and overall employment, including EPL reforms.
Figure 4Event study results – temporary employment (upper part) and employment (lower part) DISPLAY Figure
5.2 Determinants of temporary employment and employment
The results of the probit regressions (eq. 2) for both temporary employment and overall employment (Table 2) are presented next22. Namely – as already mentioned – graphical representation of the event study primarily helps in establishing flat pre-trends, while probit regressions should work for showing the average effect of the EPL reforms on labour market outcomes. Given the non-linearity of estimating models in this paper, the results in the form of marginal effects are reported, i.e., the average change in the probability of temporary employment or employment as the covariate changes (increases) by one unit. I present the results of estimations having both reform variables in one model, as well as having them separately, bearing in mind that “individual” reform variables represent the cumulative effect of both reforms23.
The main results suggest that the reform of employment protection for temporary contracts (from June 2013) – included in the model together with the EPR liberalisation dummy variable (August 2014 - December 2017) – had a positive effect on the incidence of temporary employment while the effect on the overall employment is negative (although insignificant). This result is in congruence with the interpretations from the event study (Figure 4) in the case of the effect of June 2013 reform on total employment (no effect). It is worth mentioning that the effect of EPT reform only (dummy for July 2013 – July 2014) is actually positive and significant in all the model specifications regarding the probability of temporary employment, whereas it remains negative or statistically insignificant in all model specifications for total employment (total number of employees) 24. Given the relatively short time span (July 2013 – July 2014) and the general economic conditions (recession) it is no surprise that the effect on the probability of overall employment remains negative in this period (after controlling for other variables). However, positive effect of the reform on the incidence of temporary employment suggest the occurrence of two-tier or dual labour market.
Turing to the effect of the EPR reform (dummy for August 2014 – December 2017), it has a positive effect on the probability of both temporary and overall employment, either in the model specification by itself or in combination with the EPT reform (Table 2). As already mentioned, this effect cannot be viewed only as an EPR reform since it came after the EPT liberalisation had already happened only a year before. In effect, this variable shows the influence of both reforms on the probability of employment (temporary employment), with the effect being stronger in the case of overall employment. Interestingly, the EPR reform variable of temporary employment in the model that includes EPT reform variable as well, further suggesting that this variable is probably picking up the reform that happened a year before and liberalised temporary contracts. In the case of overall employment, the effect of the EPR reform variable is slightly stronger in the model including only this variable (after July 2014).
Finally, combining both reforms into one dummy variable (July 2013 – December 2017), one can see a positive effect of the EPL reforms on both temporary and overall employment, with the effect being somewhat stronger for temporary employment in this case (Table 2). Somewhat surprisingly, the effect of the permanent contract reform variable (August 2014 – December 2017) seems to be stronger than the effect of both temporary and permanent contract reform variables combined (July 2013 – December 2017) in the case of both temporary and overall employment (Table 2). In any case, it is plausible that the liberalisation of permanent contracts seems to have induced the rise in overall employment; however, the indication that liberalisation of temporary employment might have a negative or no effect on overall employment demands further attention.
Table 2Marginal effects after probits – temporary employment among employees and employment (employees) for population aged 15-64 DISPLAY Table
In addition, the obtained results suggest that females, youths, foreigners, the lowskilled and singles from rural areas are more likely to end up on temporary contracts, which is in congruence with other findings in the literature (e.g., Kahn, 2007 or Matković, 2013). Adding regional dummies, linear time trend and GDP growth rate somewhat loosens the effect of the reform variables, while adding firm-level variables (size, ownership, occupation and industry dummies) further loosens the effect of reform variables on temporary employment; however, the main conclusions remain the same (Table A2 in Appendix).
Although the theoretical predictions from the literature (Bentolila, Dolado and Jimeno, 2019) would imply that the stricter the temporary employment provisions relative to permanent ones the lower the incidence of temporary employment 25, the results presented tend to suggest the opposite. However, there are studies (e.g., Booth, Dolado and Franck, 2002b, Kahn, 2007; Cahuc, Charlot and Malherbet, 2016) which suggest that employment protection legislation regarding temporary employment actually does not affect the incidence of temporary jobs on the labour market, but instead that regulation of permanent contracts is the one that matters 26. In essence, the findings obtained suggest that it is not only easing of temporary employment that has played a determining role in the strong increase of temporary employment in Croatia: permanent employment protection reform too has affected the rise in temporary work.
It is worth recalling that the reforms of temporary and permanent contracts in Croatia appeared consequently one after another (during one year) which means that perhaps the effect of the changes regarding temporary contracts (from June 2013) needed more time to come into full effect and thus the result of that reform is actually visible in the permanent contract reform (July 2014) as well. In addition, perhaps the overall flexibilisation of the legislation contributed to a more widespread use of temporary contracts. The Blanchared and Landier ( 2002) model, for example, predicts that with EPT liberalisation firms will be more likely to hire new workers on temporary contracts to learn about their productivity; however, they will also be less likely to keep them in regular jobs. There is also the possibility that due to the long-lasting recession employers have been (and are) still reluctant to employ workers on permanent contracts and thus there is an increase of temporary employment in the aftermath of the recession despite the liberalised permanent employment protection. Finally, I rely on OECD indices of employment protection legislation to indicate whether the reform actually happened; however, there are suggestions that the reform of permanent contracts happened only ‘on paper’ while in reality the provisions regulating regular employment stayed more-or-less the same (CNB, 2014; Potočnjak, 2014).
It was mentioned in the previous section that there is a possibility that individuals are selected in a non-random manner into (activity) employment. Applying Heckman correction for selection and using the share of dependent persons (<15 and >64 years of age) in the household as an ‘instrument’ in the selection equation (1 st stage) suggests that the selection into (activity) employment is significant, with rho coefficient (the correlation between the regression equation and the selection equation) being negative proposing that those people who are less likely to be in employment (labour market) are more likely to have a temporary contract 27. However, controlling for selection does not change the main findings from above (Table 2); the coefficients for the reform variables are slightly higher in the case of temporary employment and slightly lower in the case of total employment after controlling for selection but the main conclusions remain.
In order to further test whether individuals were perhaps sorted into different labour market outcomes after reform(s) I estimated models for the pre- and postreform period (for both 2013 and 2014 reform), naturally excluding reform variables 28. Perhaps EU accession did not only induce the change of the labour legislation; it might have also transformed the Croatian labour market in other ways. Free movement of labour is the one thing that became a dominant force for Croatian workers as migration outflows to EU countries increased considerably after July 2013. This could have affected the results in this paper as it possibly changed the composition of the domestic labour market since those who emigrated and those who have stayed probably do not have the same characteristics. However, the obtained results suggest that there are no important differences in the coefficients obtained pre and post reform(s): females, youths, foreigners, the low-skilled and singles from rural areas are more likely to end up on temporary contracts both pre and post reform(s) (similar as in Matković, 2013), with notable exceptions of the significance of urbanisation variable only in the post-reform period.
To sum up, although the event study model implied that employment protection legislation reforms from 2013 and 2014 induced a rise in temporary but not in overall employment (Figure 4) with the effect of the 2013 reform being stronger, probability regressions including reform effects in the form of dummy variables for pre and post-reform suggest that these affected the overall employment figures as well 30. Namely, it seems that employment protection legislation reforms aimed at liberalising labour legislation provisions for both temporary and permanent contracts induced not only a rise in temporary employment but consequently also an increase in overall employment on the Croatian labour market (Table 2). Contrary to theoretical predictions, liberalisation of permanent contracts increased the incidence of temporary employment as well. The explanation for this probably lies in the fact that due to the overall liberalisation of labour legislation – but also due to “recession scars” – employers were more willing to offer temporary contracts, even after permanent contracts had become more flexible as well. As expected, the liberalisation of permanent contracts increased overall employment; however, it seems that liberalisation of temporary employment might have had no or even a negative effect on overall employment. Hence, as permanent contract flexibilisation led to an increase in overall employment, only the partial labour market reform, concentrated on temporary contracts, can be seen as harmful since it increased the share of temporary contracts without increasing the overall employment level.
5.3 Alternative specifications
It has been mentioned previously that both the changes in the LFS methodology as well as additional legislative changes could have affected the occurrence of the increased share of temporary employment on the Croatian labour market as of 2013 (Figures 1, 2 and 3). Hence, in this section I test several alternative model specifications (dependent variable definitions) in order to check whether things other than EPL reforms could have influenced the main findings.
First, legislative changes that could have affected the incidence of youth (temporary) employment are the Law on the Promotion of Employment that introduced the use of the ALMP measure inducing temporary (up to a year) employment of youth population as of 2012, and the Law on Social Security Contributions that encouraged the hiring of youths on permanent contracts as of 2015. Although these two legislative changes work in the opposite direction regarding the incidence of (youth) temporary employment, in order to take into account possible effects that these changes could have on the main results, following Tomić and Žilić ( 2018) I have estimated models from Table 2 by restricting the sample to the population older than 30 (Table 3).
Table 3Marginal effects after probits – temporary employment among employees and employment (employees) for population aged 30-64 DISPLAY Table Table 4Marginal effects after probits – fixed-term contracts, temporary employment among total employment and total employment for population aged 15-64 DISPLAY Table
As evidenced in Table 3, estimation of the models on the population aged 30-64 does not change the main results available in Table 2. The size of the coefficients is a bit smaller, while the signs and the significance remain the same 30. In addition, event study results on the restricted sample (Figure 5) reveal a pattern similar to that of the original estimation (Figure 4), with somewhat greater oscillations between the size of the coefficients, but with a general conclusion remaining the same. This suggest that the main results (Table 2) are not influenced by youth employment in the observed period, or by the legislative changes regarding their employment.
Second, it has been mentioned that the definition of temporary employment used in the previous models might be too broad when discussing the employment protection legislation reform(s). Therefore, I have also conducted an analysis restricted to fixed-term contracts as part of temporary employment. A graphical representation of the event study focusing on the incidence of fixed-term contracts is presented in Figure 6, while main regression results are available in Table 4.
Figure 6 resembles the upper part of Figure 4; however, even in the case of the June 2013 reform (temporary contracts liberalisation) some of the pre-reform parameters are statistically significant (although close to zero). The results from Table 4 are very similar to those in Table 2 that encompass total temporary employment (fixed-term contracts, seasonal and occasional work), with the estimated coefficients being slightly smaller in size in the case of fixed-term contracts only. These results suggest that the enacted labour legislation reforms have had an impact on the incidence on temporary employment, but somewhat more pronounced when covering all forms of temporary employment than when just concentrating on fixed-term contracts.
In order to further test the issues with the definition of temporary employment and the change in the methodology in 2014 (switch of some occasional contracts between self-employment and temporary employment), Table 4 presents two additional estimations in which dependent variables are somewhat differently defined. The overall temporary employment is defined as a share among the total employment (instead of among the total number of employees) while total employment among the active population is taken as the relevant parameter instead of the total number of employees. In this way, the developments among the self-employed portion of total employment are also taken into account. Comparing these results with those in Table 2, one can see that the main conclusions remain the same (the only notable exception being the gain of the statistical significance for the EPT reform dummy in the case of its negative effect on the probability of total employment). Although the coefficients are slightly smaller in size, one can conclude that both temporary and permanent contracts liberalisation have had a positive impact on the incidence of temporary employment, whereas the effect of temporary contracts liberalisation on the incidence of overall employment is not entirely clear. All things considered, the definition of dependent variables (temporary employment and employment) does not drive the main findings, as the alternative specifications bring to the same conclusions.
Figure 5Event study results - temporary employment (upper part) and employment (lower part) for population aged 30-64 DISPLAY Figure Figure 6Event study results for fixed contracts only DISPLAY Figure
6 Conclusions
This paper examines the effects of employment protection legislation reforms from 2013 and 2014 on employment outcomes in Croatia, testing the theoretical predictions of two-tier labour market reforms on labour market outcomes from the literature. With a push from the EU accession and the need to harmonize legislation, the reforms liberalized EP provisions for both temporary (2013) and permanent (2014) contracts thus presenting a particularly interesting case for policy evaluation. Using the LFS data in the period 2007-2017 and applying the event study method in combination with probit regressions, the main results suggest that employment protection legislation reforms from 2013 and 2014 induced a rise in temporary employment, while the effects on the overall employment are clearly visible only in the case of the second (permanent contracts) reform. Thus, it seems that the liberalisation of permanent contracts has led to an increase in overall employment, while only partial EPL reform concentrated on temporary contracts was actually detrimental, as it induced an increase of the share of temporary contracts without increasing the overall employment level. In addition, probit regression estimations suggest that specific groups of the population – females, youths, foreigners, the low-skilled and singles from rural areas – have a higher probability of ending up with temporary contracts. These results are further tested applying different model specifications, but also focusing on different definitions of temporary employment; however, they largely confirm the basic set of results.
Nevertheless, there are some caveats that need to be taken into account here. For example, I have concentrated on the OECD indices of employment protection legislation to indicate whether the reform actually happened; however, these indices might not be entirely representative of how the things actually work in practice. This is especially true for the flexibilisation of permanent contracts (2014 reform). Moreover, labour legislation includes provisions other than the Labour Act that could have affected some of the changes on the Croatian labour market in recent years. However, alternative model specifications that have tried to take into account possible effects of other legislative changes did not change the main findings. Finally, the recession – with the accompanying processes of globalisation and digitalisation – and the consequent accommodation of both employers and workers could have changed the importance of temporary vs permanent work on the Croatian labour market.
Still, one must not disregard the effects that the labour legislation reform had on the incidence of temporary employment and on the overall trends on the Croatian labour market. This is not only the case for different forms of employment, but it can have larger effects on the formation of human capital, increasing inequalities, and even further encouraging outward migration. Sound policy evaluation, both ex-ante and ex-post, is notably absent in Croatia, while at the same time legislation is constantly changing. As the labour legislation reforms from 2013 and 2014 were mainly induced from the outside, that is, by the need to harmonise Croatian regulations with those of the EU, the lessons learned in the case of Croatia might be valuable for candidate and future accession countries.
Further steps in the analysis of the impact of labour legislation on labour market outcomes in Croatia should also focus on other outcomes on the labour market, such as labour market participation or wages, as well as on individual outcomes that could have been affected by the increased incidence of temporary employment, including the formation of marriage, having children, homeownership and/ or living with one’s parents. As the analysis in this paper showed that specific groups of workers, such as youths or females, are more likely to end up on temporary employment contracts more focus should be put on those specific groups as well. Perhaps it is the decisions on the supply side and not on the demand side that drive the overall results. In addition, although rich in the number of individual and labour market related variables, the LFS dataset might not be the best source of data for examining the effects of labour legislation reforms on labour market outcomes. Another possibility is the use of administrative data with detailed specifications of different types of contract and their duration, while another approach could be the use of firm-level data to check if legislation provisions induced changes in the type of employment contracts among different sectors, firm sizes and similar matters. In any case, this is too important to be disregarded in academic discourse.
Appendix
Table A1Descriptive statistics DISPLAY Table
Table A2Marginal effects after probits for temporary employment DISPLAY Table
Table A3Marginal effects after probits for employment DISPLAY Table
Figure A1Event study results on a monthly level DISPLAY Figure
Funding
This work has been supported in part by ZAMAH (HR.3.2.01-0136) and by Tvoj Grant@EIZ.
Notes
* The author would like to thank Valerija Botrić, Marina Kunovac, Ivica Rubil and Ivan Žilić, as well as participants at the LSEE Workshop on Economics of the Western Balkans and two anonymous referees for helpful discussions and valuable comments on the paper.
1 See Saint-Paul (1996), Boeri (2011) or Bentolila, Dolado and Jimeno (2019) for synthesis reports on dualism in (European) labour markets.
2 Matković (2013) finds that in the pre-crisis period temporary contracts were more frequently used in the peripheral part of the private sector for hiring young workers and low-skilled workers in routine manual and service occupations.
3 As often argued, due to downward wage rigidity labour market adjustments in the crisis happened through employment cuts. The literature suggests that the effects of EPL on temporary employment are actually stronger in countries that exhibit more downward wage rigidity (Kahn, 2007).
4 A part of the underlying reason is the decline of the working-age population and a change in generational composition of the workforce due to population ageing. Nevertheless, the employment rate surpassed (by a small margin) the 2008 levels only in 2018 (not covered in the empirical analysis).
5 Act on Amendments to the Labour Act (OG 73/2013) was passed on 18 June 2013 (in force after 8 days).
6 The main changes of the law in 2013 were that it introduced the possibility that the first fixed-term contract lasts longer than three years (concluding more successive employment contracts remains limited to a maximum of three years), while the provisions on collective surpluses of workers have been simplified and the whole process was shortened.
7 Labour Act (OG 93/2014) was passed on 30 July 2014 (in force after 8 days).
8 The main changes in this regard have been the simplification of procedures when firing workers on permanent contracts (the abolition of the provisions regarding the obligatory retraining or displacement to another job before the dismissal), changes in the organisation of work with respect to working hours, plus potential lowering of the firing costs as the compensation for termination of employment contract in court has been reduced from a maximum of 18 to a maximum of 8 average wages.
9 The possibility of working via a temporary agency has been increased from one to three years. However, fewer than 1% of workers are employed through temporary agency, without significant changes in recent years.
10 More details on EPL reforms in Croatia in 2013 and 2014 can be found in Kunovac (2014), CNB (2014), Potočnjak (2014) and Brkić (2015), and additional information on previous reforms can be found in Matković and Biondić (2003), Vukorepa (2010), Tomić and Domadenik (2012) and Tomić (2013).
11 See Tomić and Žilić (2018) for more details about this. For example, they report that the number of participants in the programme increased from below 500 in 2010 to 33,366 in 2016.
12 Both vocational training without commencing employment (up to a year) and seasonal work in agriculture via vouchers (up to 90 days over the year) have been introduced by the Law on the Promotion of Employment (OG 57/2012, 120/2012, 16/2017).
13 According to the Law on Social Security Contributions (OG 84/2008, 152/2008, 94/2009, 18/2011, 22/2012, 144/2012, 148/2013, 41/2014, 143/2014, 115/2016, 106/2018). The Croatian Pension Insurance Institute reports that the number of people using this possibility for employment increased from slightly more than 10,000 in March 2015 to more than 83,000 at the end of 2017 (more than 108,000 at the end of 2018).
14 See the next subsection and Table A1 in the Appendix for more details.
15 I also test for non-random selection of individuals into (temporary) employment by applying the so-called Heckman correction for selection, i.e., I estimate the model in two stages where in the first stage the probability of a person being employed (or economically active) is estimated, which is then used as an adjustment parameter in the second-stage equation.
16 Linear trends should also help account for differences in pre-trends in the incidence of temporary employment, i.e., they would help absorb a spuriously significant coefficient (Simon, 2016).
17 One could argue that the date of the contract is endogenous as a person is employed based on his/her observable and unobservable characteristics; however, I control for other characteristics in the model as well.
18 Apart from fixed-term contracts, the OECD definition of temporary employment covers temporary agency workers, daily workers, trainees, people in job creation schemes, workers on contracts for a specific task, those on replacement contracts, and on-call workers (OECD, 2002).
19 It has been mentioned earlier that the Government introduced the law in 2012 with the possibility of seasonal work in agriculture via vouchers up to 90 days throughout the year. However, the share of seasonal workers among temporary employees actually decreased in 2012 and 2013 before it rose again in 2014-2017 (excluding 2015, Figure 2), but mainly due to seasonal work in the tourism sector. Other factors, such as different forms of youth employment via Government incentives, might have influenced the incidence of temporary employment; however, the two incentives (vocational training without commencing employment (temporary employment by definition) and employment of youths on permanent contract without the payment of employers’ contributions) actually work in the opposite directions regarding temporary employment.
20 I show the results on a quarterly instead on a monthly level given that “using more aggregated event dummies reduces noise and makes the pattern of the coefficients smoother” (Simon, 2016: 139). The same results estimated on a monthly level are available in the Appendix (Figure A1) where it is obvious that since the estimation contains “thrice as many coefficients with the same number of observations, each individual coefficient is less precisely estimated” (Perez-Truglia, 2019: i).
21 Available upon request.
22 Table 2 presents the preferred model specification, while other model specifications are available in Appendix and/or upon request.
23 For example, the second reform dummy variable (August 2014-December 2017) also includes the ‘cumulative effect’ as the reform came in on top of the first (from June 2013) reform. In addition, the results of the reform variables modelled as dummies are presented here; however, using EPL indices (Table 1) instead of dummy variables gives qualitatively the same results (available upon request). Additionally, I have estimated all the models using linear probability regressions and the obtained results are much the same as those presented here (available upon request).
24 Available in tables in the Appendix and/or upon request.
25 The same model predicts that in the case when restrictions for permanent and temporary contracts are similar (the same), the easing of the former will lead to more permanent contracts as well as to more fixed-term contracts. All the same, this theory predicts that liberalisation of the permanent contracts would lead to a reduction of the share of temporary employment on the labour market in the end (Bentolila, Dolado and Jimeno, 2019), which is not what the obtained results here show.
26 For example, Cahuc, Charlot and Malherbet (2016) in their theoretical model show that the protection of permanent jobs does not have an important effect on total employment; however, it does induce the substitution of temporary jobs for permanent jobs.
27 Detailed results available upon request.
28 Detailed results available upon request.
29 It is important to remember that in the event study models I have used specific dummies referring to j periods away from the reform but related to the individuals’ employment contract date, whereas in the probit regressions reform variables are just dummies indicating 1 after the reform occurred and 0 before that (not specifically related to the time of the contract).
30 Detailed results available upon request.
* The author would like to thank Valerija Botrić, Marina Kunovac, Ivica Rubil and Ivan Žilić, as well as participants at the LSEE Workshop on Economics of the Western Balkans and two anonymous referees for helpful discussions and valuable comments on the paper.
1 See Saint-Paul ( 1996), Boeri ( 2011) or Bentolila, Dolado and Jimeno ( 2019) for synthesis reports on dualism in (European) labour markets.
2 Matković ( 2013) finds that in the pre-crisis period temporary contracts were more frequently used in the peripheral part of the private sector for hiring young workers and low-skilled workers in routine manual and service occupations.
3 As often argued, due to downward wage rigidity labour market adjustments in the crisis happened through employment cuts. The literature suggests that the effects of EPL on temporary employment are actually stronger in countries that exhibit more downward wage rigidity (Kahn, 2007).
4 A part of the underlying reason is the decline of the working-age population and a change in generational composition of the workforce due to population ageing. Nevertheless, the employment rate surpassed (by a small margin) the 2008 levels only in 2018 (not covered in the empirical analysis).
5 Act on Amendments to the Labour Act (OG 73/2013) was passed on 18 June 2013 (in force after 8 days).
6 The main changes of the law in 2013 were that it introduced the possibility that the first fixed-term contract lasts longer than three years (concluding more successive employment contracts remains limited to a maximum of three years), while the provisions on collective surpluses of workers have been simplified and the whole process was shortened.
7 Labour Act (OG 93/2014) was passed on 30 July 2014 (in force after 8 days).
8 The main changes in this regard have been the simplification of procedures when firing workers on permanent contracts (the abolition of the provisions regarding the obligatory retraining or displacement to another job before the dismissal), changes in the organisation of work with respect to working hours, plus potential lowering of the firing costs as the compensation for termination of employment contract in court has been reduced from a maximum of 18 to a maximum of 8 average wages.
9 The possibility of working via a temporary agency has been increased from one to three years. However, fewer than 1% of workers are employed through temporary agency, without significant changes in recent years.
10 More details on EPL reforms in Croatia in 2013 and 2014 can be found in Kunovac ( 2014), CNB ( 2014), Potočnjak ( 2014) and Brkić ( 2015), and additional information on previous reforms can be found in Matković and Biondić ( 2003), Vukorepa ( 2010), Tomić and Domadenik ( 2012) and Tomić ( 2013).
11 See Tomić and Žilić ( 2018) for more details about this. For example, they report that the number of participants in the programme increased from below 500 in 2010 to 33,366 in 2016.
12 Both vocational training without commencing employment (up to a year) and seasonal work in agriculture via vouchers (up to 90 days over the year) have been introduced by the Law on the Promotion of Employment (OG 57/2012, 120/2012, 16/2017).
13 According to the Law on Social Security Contributions (OG 84/2008, 152/2008, 94/2009, 18/2011, 22/2012, 144/2012, 148/2013, 41/2014, 143/2014, 115/2016, 106/2018). The Croatian Pension Insurance Institute reports that the number of people using this possibility for employment increased from slightly more than 10,000 in March 2015 to more than 83,000 at the end of 2017 (more than 108,000 at the end of 2018).
14 See the next subsection and Table A1 in the Appendix for more details.
15 I also test for non-random selection of individuals into (temporary) employment by applying the so-called Heckman correction for selection, i.e., I estimate the model in two stages where in the first stage the probability of a person being employed (or economically active) is estimated, which is then used as an adjustment parameter in the second-stage equation.
16 Linear trends should also help account for differences in pre-trends in the incidence of temporary employment, i.e., they would help absorb a spuriously significant coefficient (Simon, 2016).
17 One could argue that the date of the contract is endogenous as a person is employed based on his/her observable and unobservable characteristics; however, I control for other characteristics in the model as well.
18 Apart from fixed-term contracts, the OECD definition of temporary employment covers temporary agency workers, daily workers, trainees, people in job creation schemes, workers on contracts for a specific task, those on replacement contracts, and on-call workers (OECD, 2002).
19 It has been mentioned earlier that the Government introduced the law in 2012 with the possibility of seasonal work in agriculture via vouchers up to 90 days throughout the year. However, the share of seasonal workers among temporary employees actually decreased in 2012 and 2013 before it rose again in 2014-2017 (excluding 2015, Figure 2), but mainly due to seasonal work in the tourism sector. Other factors, such as different forms of youth employment via Government incentives, might have influenced the incidence of temporary employment; however, the two incentives (vocational training without commencing employment (temporary employment by definition) and employment of youths on permanent contract without the payment of employers’ contributions) actually work in the opposite directions regarding temporary employment.
20 I show the results on a quarterly instead on a monthly level given that “using more aggregated event dummies reduces noise and makes the pattern of the coefficients smoother” (Simon, 2016: 139). The same results estimated on a monthly level are available in the Appendix (Figure A1) where it is obvious that since the estimation contains “thrice as many coefficients with the same number of observations, each individual coefficient is less precisely estimated” (Perez-Truglia, 2019: i).
21 Available upon request.
22 Table 2 presents the preferred model specification, while other model specifications are available in Appendix and/or upon request.
23 For example, the second reform dummy variable (August 2014-December 2017) also includes the ‘cumulative effect’ as the reform came in on top of the first (from June 2013) reform. In addition, the results of the reform variables modelled as dummies are presented here; however, using EPL indices (Table 1) instead of dummy variables gives qualitatively the same results (available upon request). Additionally, I have estimated all the models using linear probability regressions and the obtained results are much the same as those presented here (available upon request).
24 Available in tables in the Appendix and/or upon request.
25 The same model predicts that in the case when restrictions for permanent and temporary contracts are similar (the same), the easing of the former will lead to more permanent contracts as well as to more fixed-term contracts. All the same, this theory predicts that liberalisation of the permanent contracts would lead to a reduction of the share of temporary employment on the labour market in the end (Bentolila, Dolado and Jimeno, 2019), which is not what the obtained results here show.
26 For example, Cahuc, Charlot and Malherbet ( 2016) in their theoretical model show that the protection of permanent jobs does not have an important effect on total employment; however, it does induce the substitution of temporary jobs for permanent jobs.
27 Detailed results available upon request.
28 Detailed results available upon request.
29 It is important to remember that in the event study models I have used specific dummies referring to j periods away from the reform but related to the individuals’ employment contract date, whereas in the probit regressions reform variables are just dummies indicating 1 after the reform occurred and 0 before that (not specifically related to the time of the contract).
30 Detailed results available upon request.
Disclosure statement
No potential conflict of interest was reported by the author.
References
Barbieri, P. and Cutuli, G., 2015. Employment protection legislation, labour market dualism, and inequality in Europe. European Sociological Review, 32(4), pp. 501-516 [ CrossRef]
Barbieri, P. and Cutuli, G., 2018. Dual labour market intermediaries in Italy: How to lay off “lemons” – Thereby creating a problem of adverse selection. De Economist, 166(4), pp. 477-502 [ CrossRef]
Bentolila, S., Dolado, J. K. and Jimeno, J. F., 2019. Dual Labour Markets Revisited. IZA Discussion Paper, No. 12126. Bonn: Institute for the Study of Labor (IZA).
Blanchard, O. and Landier, A., 2002. The perverse effects of partial labour market reform: fixed‐term contracts in France. The Economic Journal, 112(480), pp. F214-F244 [ CrossRef]
Blossfeld, H. P. [et al.], 2012. Selective flexibilization and deregulation of the labor market. The answer of Continental and Southern Europe. Stato e mercato, 32(3), pp. 363-390.
Boeri, T. and Garibaldi, P., 2007. Two tier reforms of employment protection: A honeymoon effect?. The Economic Journal, 117(521), pp. F357-F385 [ CrossRef]
Boeri, T., 2011. Institutional Reforms and Dualism in European Labor Markets. In: O. C. Ashenfelter and D. Card, eds. Handbook of Labor Economics. Amsterdam: North-Holland, pp. 1173-1236 [ CrossRef]
Booth, A. L., Dolado, J. J. and Frank, J., 2002b. Symposium on temporary work: Introduction. The Economic Journal, 112(480), pp. F181-F188 [ CrossRef]
Booth, A. L., Francesconi, M. and Frank, J., 2002a. Temporary jobs: stepping stones or dead ends?. The Economic Journal, 112(480), pp. F189-F213 [ CrossRef]
Brkić, M., 2015. Labor market duality and the impact of prolonged recession on employment in Croatia. Croatian economic survey, 17(1), pp. 5-45 [ CrossRef]
Cahuc, P. and Postel-Vinay, F., 2002. Temporary jobs, employment protection and labor market performance. Labour economics, 9(1), pp. 63-91 [ CrossRef]
Cahuc, P., Charlot, O. and Malherbet, F., 2016. Explaining the spread of temporary jobs and its impact on labor turnover. International Economic Review, 57(2), pp. 533-572 [ CrossRef]
Centeno, M. and Novo, Á. A., 2012. Excess worker turnover and fixed-term contracts: Causal evidence in a two-tier system. Labour Economics, 19(3), pp. 320-328 [ CrossRef]
Eichhorst, W. and Marx, P., 2019. How Stable Is Labour Market Dualism? Reforms of Employment Protection in Nine European Countries. IZA Discussion Paper, No. 12309. Bonn: Institute for the Study of Labor
Franičević, V., 2011. Croatia: Prolonged crisis with an uncertain ending. In D. Vaughan-Whitehead, ed. Inequalities in the world of work: The effects of the crisis. Geneve: ILO, pp. 139-208 [ CrossRef]
Fuest, C., Peichl, A. and Siegloch, S., 2018. Do higher corporate taxes reduce wages? Micro evidence from Germany. American Economic Review, 108(2), pp. 393-418 [ CrossRef]
Hijzen, A., Mondauto, L. and Scarpetta, S., 2017. The impact of employment protection on temporary employment: Evidence from a regression discontinuity design. Labour Economics, 46, pp. 64-76 [ CrossRef]
Kahn, L. M., 2007. The impact of employment protection mandates on demographic temporary employment patterns: International microeconomic evidence. The Economic Journal, 117(521), pp. F333-F356 [ CrossRef]
Kahn, L. M., 2010. Employment protection reforms, employment and the incidence of temporary jobs in Europe: 1996–2001. Labour Economics, 17(1), pp. 1-15 [ CrossRef]
Kunovac, M., 2014. Employment protection legislation in Croatia. Financial theory and practice, 38(2), pp. 139-172 [ CrossRef]
Matković, T., 2013. ‘Flexicurity’through Normalization? Changes in Scope, Composition and Conditions of Temporary Employment in Croatia. In M. Koch and M. Fritz, eds. Non-Standard Employment in Europe. London: Palgrave Macmillan, pp. 84-102 [ CrossRef]
Nickell, S., 1997. Unemployment and Labor Market Rigidities: Europe versus North America. J ournal of Economic Perspectives, 11(3), pp. 55-74 [ CrossRef]
OECD, 2002. Employment Outlook. Paris: OECD
Perez-Truglia, R., 2019. The effects of income transparency on well-being: Evidence from a natural experiment. NBER Working Paper, No. w25622 [ CrossRef]
Piton, C. and Rycx, F., 2018. The unemployment impact of product and labour market regulation: Evidence from European countries. IZA Discussion Papers, No. 11582. Bonn: Institute for the Study of Labor (IZA) [ CrossRef]
Potočnjak, Ž., 2014. Najznačajnije novine koje donosi novi Zakon o radu. Hrvatska pravna revija, 14(9), pp. 14-30
Račić, D., Babić, Z. and Podrug, N., 2005. Segmentation of the labour market and employee rights in Croatia. Revija za socijalnu politiku, 12(1), pp. 45-66 [ CrossRef]
Saint-Paul, G., 1996. Dual labor markets: a macroeconomic perspective. Cambridge, MA and London: MIT press
Sala, H., Silva, J. I. and Toledo, M., 2012. Flexibility at the margin and labor market volatility in OECD countries. The Scandinavian Journal of Economics, 114(3), pp. 991-1017 [ CrossRef]
Siebert, H., 1997. Labor Market Rigidities: At the Root of Unemployment in Europe. Journal of Economic Perspectives, 11(3), pp. 37-54 [ CrossRef]
Simon, D., 2016. Does early life exposure to cigarette smoke permanently harm childhood welfare? Evidence from cigarette tax hikes. American Economic Journal: Applied Economics, 8(4), pp. 128-159 [ CrossRef]
Tejada, M. M., 2017. Dual labor markets and labor protection in an estimated search and matching model. Labour Economics, 46, pp. 26-46 [ CrossRef]
Tomić, I. and Domadenik, P., 2012. Matching, adverse selection and labour market flows in a (post) transition setting: the case of Croatia. Post-communist economies, 24(1), pp. 39-72 [ CrossRef]
Tomić, I. and Žilić, I., 2018. Working for 200 euro? The effects of traineeship reform on labor market outcomes in Croatia. EIZ Working Papers, No. 4. Zagreb: Institute for Economics.
Tomić, I., 2013. Essays on the labour market in a post-transition economy: the case of Croatia. Doctoral dissertation. Ljubljana: Faculty of Economics.
Vodopivec, M., Laporsek, S. and Vodopivec, M., 2016. Levelling the playing field: the effects of Slovenia's 2013 labour market reform. IZA Discussion Paper, No. 9783. Bonn: Institute for the Study of Labor
Vukorepa, I., 2010. Novi zakon o radu. Revija za socijalnu politiku, 17(2), pp. 333-337 [ CrossRef]
Vukšić, G., 2014. Employment and employment conditions in the current economic crisis in Croatia. Financial theory and practice, 38(2), pp. 103-138 [ CrossRef]
World Bank, 2010. Social Impact of the Crisis and Building Resilience. Zagreb: The World Bank
|
|
|
March, 2020
I/2020
|


