2474
Views
207
Downloads |
Achievements and unfinished agenda of the fiscal equalization system in Croatia
Marko Primorac*
 Marko Primorac
Affiliation:
Marko Primorac
Affiliation: CESifo Research Network, Munich, Germany University of Zagreb, Faculty of Economics & Business, Zagreb, Croatia
 0000-0003-1629-3170 0000-0003-1629-3170
Jorge Martínez-Vázquez* 
Jorge Martínez-Vázquez
Affiliation: International Center for Public Policy (Georgia State University), Atlanta, GA 3030 Governance and Economics Research Network (GEN), Campus Universitario As Lagoas s/n, Ourense, Spain Georgia State University, Atlanta, Georgia, USA
0000-0003-2230-9204
Correspondence
jorgemartinez@gsu.edu
Article | Year: 2022 | Pages: 533 - 567 | Volume: 46 | Issue: 4 Received: March 16, 2022 | Accepted: May 31, 2022 | Published online: December 7, 2022
|

FULL ARTICLE
FIGURES & DATA
REFERENCES
CROSSMARK POLICY
METRICS
LICENCING
PDF
Source: Authors’ calculation, based on the data from the Report on revenues and expenditures,
receipts and expenses (Form PR-RAS) for the years 2000-2020.
Source: Authors’ calculation, based on the data from the Report on revenues and expenditures,
receipts and expenses (Form PR-RAS) for the years 2000-2020.
|
Period
(d/m/yyy)
|
Central government
|
County
|
City/
municipality
|
Decentralized functions
|
Equalization fund for decentralized
functions
|
EU projects
|
|
1/1/1994-1/4/2000
|
70
|
5
|
25
|
|
|
|
|
1/4/2000-1/7/2001
|
60
|
8
|
32
|
|
|
|
|
1/7/2001-1/1/2002
|
29.2
|
8
|
32
|
9.8
|
21
|
|
|
1/1/2002-1/1/2003
|
29.6
|
8
|
32
|
9.4
|
21
|
|
|
1/1/2003-1/1/2007
|
25.6
|
10
|
34
|
9.4
|
21
|
|
|
1/1/2007-1/7/2008
|
|
15
|
52
|
12
|
21
|
|
|
1/7/2008-1/3/2012
|
|
15.5
|
55
|
12
|
17.5
|
|
|
1/3/2012-1/1/2015
|
|
16.0
|
56.5
|
12
|
15.5
|
|
|
1/1/2015-1/1/2018
|
|
16.5
|
60
|
6
|
16
|
1.5*
|
|
1/1/2018-1/1/2021
|
|
17
|
60
|
6
|
17**
|
|
|
1/1/2021-
|
|
20
|
74
|
6
|
|
|
Source: Law on Financing of Local and Regional Self-Government Units (OG 117/93, 33/00, 59/01, 107/01, 117/01, 150/02, 147/03, 132/06, 73/08, 25/12, 147/14, 100/15, 115/16 and 127/17, 138/20).
Source: Authors’ calculation based on the data from the Report on revenues and expenditures,
receipts and expenses (Form PR-RAS) for the years 2017 and 2018.
|
|
Own revenues
|
(1) +
Shared revenues
|
(2) +
Equalization transfers
|
(3) +
Other transfers
|
Expenditures
|
|
|
(1)
|
(2)
|
(3)
|
(4)
|
(5)
|
|
Counties
|
|
Min, HRK
|
156.8
|
352.5
|
503.5
|
999.8
|
1,049.4
|
|
Max, HRK
|
489.2
|
956.2
|
956.2
|
2,941.7
|
2,757.0
|
|
Range (max-min), HRK
|
332.4
|
603.7
|
452.7
|
1,941.8
|
1,707.6
|
|
Average, HRK
|
323.4
|
595.6
|
660.2
|
1,392.8
|
1,382.2
|
|
Median, HRK
|
329.2
|
569.5
|
628.2
|
1,275.6
|
1,288.2
|
|
Standard deviation, HRK
|
83.8
|
156.9
|
113.3
|
421.4
|
376.9
|
|
Coefficient of variation (%)
|
25.9
|
26.3
|
17.2
|
30.3
|
27.3
|
|
Gini coefficient
|
0.142
|
0.138
|
0.088
|
0.126
|
0.114
|
|
Cities
|
|
Min, HRK
|
469.5
|
972.0
|
2,364.8
|
2,405.4
|
2,029.9
|
|
Max, HRK
|
9,538.8
|
10,912.2
|
11,042.2
|
12,031.3
|
14,053.9
|
|
Range (max-min), HRK
|
9,069.3
|
9,940.2
|
8,677.4
|
9,625.9
|
12,023.9
|
|
Average, HRK
|
2,440.0
|
3,803.1
|
4,571.0
|
5,401.4
|
5,316.2
|
|
Median, HRK
|
1,584.4
|
2,887.4
|
3,817.9
|
4,821.5
|
4,695.0
|
|
Standard deviation, HRK
|
2,096.6
|
2,469.5
|
2,115.6
|
2,213.5
|
2,502.8
|
|
Coefficient of variation (%)
|
85.9
|
64.9
|
46.3
|
41.0
|
47.1
|
|
Gini coefficient
|
0.429
|
0.336
|
0.233
|
0.218
|
0.247
|
|
Municipalities
|
|
Min, HRK
|
104.5
|
464.5
|
1,543.7
|
1,726.0
|
1,495.4
|
|
Max, HRK
|
13,934.2
|
15,855.1
|
15,855.1
|
26,749.9
|
29,477.4
|
|
Range (max-min), HRK
|
13,829.7
|
15,390.6
|
14,311.4
|
25,023.9
|
27,981.9
|
|
Average, HRK
|
1,955.0
|
2,815.3
|
3,738.7
|
4,839.9
|
4,741.0
|
|
Median, HRK
|
991.5
|
1,792.0
|
2,872.4
|
3,847.6
|
3,758.1
|
|
Standard deviation, HRK
|
2,313.3
|
2,616.7
|
2,310.6
|
2,995.4
|
3,167.8
|
|
Coefficient of variation (%)
|
118.3
|
92.9
|
61.8
|
61.9
|
66.8
|
|
Gini coefficient
|
0.523
|
0.425
|
0.277
|
0.281
|
0.303
|
Note: GPS: general public services, DEF: defense, POS: public order and safety, EA: economic
affairs, ENV: environment, HC: housing and community, HLT: health, RCR: recreation, culture,
and religion, EDU: education, SP: social protection. Source: Authors’ calculation, based on the data from the Report on revenues and expenditures,
receipts and expenses (Form PR-RAS) for the years 2000-2020.
|
Max
|
Min
|
Average
|
Median
|
St. dev.
|
Coefficient of variation (%)
|
|
Local Government
Units (cities and municipalities)
|
|
GPS
|
15,242.7
|
0.0
|
1,180.8
|
935.8
|
1,066.2
|
90.3
|
|
DEF
|
211.5
|
0.0
|
2.5
|
0.0
|
12.9
|
507.9
|
|
POS
|
2,056.4
|
0.0
|
125.6
|
90.5
|
140.7
|
112.0
|
|
EA
|
28,563.0
|
0.0
|
936.0
|
615.1
|
1,551.9
|
165.8
|
|
ENV
|
4,575.0
|
0.0
|
234.1
|
85.1
|
447.5
|
191.2
|
|
HC
|
9,449.6
|
0.0
|
1,184.4
|
885.2
|
1,172.9
|
99.0
|
|
HLT
|
408.4
|
0.0
|
18.4
|
2.5
|
36.0
|
195.0
|
|
RCR
|
6,007.4
|
0.0
|
381.3
|
246.3
|
529.4
|
138.8
|
|
EDU
|
6,431.5
|
0.0
|
281.4
|
184.8
|
425.0
|
151.0
|
|
SP
|
10,840.2
|
0.0
|
221.1
|
134.8
|
500.0
|
226.1
|
|
Total
|
29,477.4
|
1,465.9
|
4,565.6
|
3,699.2
|
2,944.1
|
64.5
|
|
Regional
Government Units (counties)
|
|
GPS
|
353.7
|
125.7
|
207.9
|
186.4
|
65.6
|
31.6
|
|
DEF
|
1.0
|
0.0
|
0.1
|
0.0
|
0.3
|
261.9
|
|
POS
|
147.0
|
3.5
|
17.5
|
9.4
|
30.9
|
176.1
|
|
EA
|
1,503.5
|
61.4
|
238.7
|
127.8
|
339.9
|
142.4
|
|
ENV
|
41.5
|
0.0
|
13.5
|
12.4
|
11.4
|
84.4
|
|
HC
|
105.7
|
0.0
|
22.9
|
13.1
|
29.0
|
126.7
|
|
HLT
|
145.1
|
5.5
|
39.9
|
30.8
|
36.3
|
90.9
|
|
RCR
|
122.5
|
8.7
|
47.0
|
38.3
|
30.3
|
64.4
|
|
EDU
|
397.9
|
32.6
|
197.6
|
204.2
|
99.7
|
50.4
|
|
SP
|
74.5
|
29.2
|
47.5
|
43.7
|
13.9
|
29.3
|
|
Total
|
2,061.2
|
511.1
|
832.6
|
793.3
|
337.4
|
40.5
|
Note: GPS: general public services, DEF: defense, POS: public order and safety, EA: economic affairs, ENV: environment, HC: housing and community, HLT: health, RCR: recreation, culture and religion, EDU: education, and SP: social protection. Source: Authors’ calculation, based on the data from the Report on Revenues and Expenditures, Receipts and Expenses (Form PR-RAS) for 2018.
|
General public services
|
Health
|
Primary education
|
Secondary education
|
Social
protection
|
|
Share in total
|
26.1
|
4.1
|
8.0
|
8.5
|
6.1
|
|
Cumulative share
|
26.1
|
30.2
|
38.2
|
46.7
|
52.8
|
Source: Authors’ calculation, based on the data from the Report on expenditure according to functional classification (Form RAS-functional) for 2018.
|
General public services
|
Health
|
Primary
education
|
Secondary education
|
Social
protection
|
|
Max
|
353.7
|
145.1
|
143.9
|
220.5
|
74.5
|
|
Min
|
125.7
|
5.5
|
0.0
|
0.0
|
29.2
|
|
Average
|
207.9
|
39.9
|
49.5
|
71.8
|
47.5
|
|
Median
|
186.4
|
30.8
|
38.2
|
68.7
|
43.7
|
|
Standard deviation
|
65.6
|
36.3
|
45.2
|
69.2
|
13.9
|
|
Coefficient of variation (%)
|
31.6
|
90.9
|
91.2
|
96.3
|
29.3
|
|
Gini coefficient
|
0.168
|
0.431
|
0.497
|
0.521
|
0.158
|
|
Cities
|
Municipalities
|
|
Share in total
|
Cumulative share
|
Share in total
|
Cumulative share
|
|
General public services
|
23.6
|
23.6
|
25.1
|
25.1
|
|
Firefighting
|
1.5
|
25.1
|
2.7
|
27.9
|
|
Road traffic
|
6.9
|
31.9
|
9.2
|
37.1
|
|
Waste management
|
2.7
|
34.7
|
2.1
|
39.2
|
|
Community development
|
10.6
|
45.2
|
11.8
|
51.0
|
|
Street lights
|
2.3
|
47.6
|
3.7
|
54.6
|
|
Health
|
1.3
|
48.9
|
0.5
|
55.1
|
|
Recreation and sport
|
6.4
|
55.3
|
2.7
|
57.8
|
|
Culture
|
3.3
|
58.6
|
2.6
|
60.3
|
|
Preschool education
|
2.1
|
60.7
|
4.1
|
64.4
|
|
Primary education
|
4.9
|
65.6
|
1.4
|
65.9
|
|
Secondary education
|
2.1
|
67.7
|
0.4
|
66.2
|
|
Social protection
|
5.6
|
73.3
|
5.0
|
71.2
|
|
Max
|
Min
|
Average
|
Median
|
Standard deviation
|
Coefficient of variation
|
Gini
coefficient
|
|
GPS
|
10,370.13
|
186.41
|
1,082.54
|
863.68
|
1,000.31
|
0.92
|
0.32
|
|
FF
|
418.61
|
0.00
|
95.07
|
62.15
|
92.42
|
0.97
|
0.48
|
|
RT
|
2,393.84
|
0.00
|
401.28
|
322.04
|
454.64
|
1.13
|
0.56
|
|
WM
|
2,089.36
|
0.00
|
143.20
|
42.02
|
307.99
|
2.15
|
0.74
|
|
CD
|
4,480.03
|
0.00
|
519.55
|
234.97
|
693.88
|
1.34
|
0.63
|
|
SL
|
1,592.96
|
0.00
|
154.64
|
128.14
|
168.39
|
1.09
|
0.44
|
|
HLT
|
204.83
|
0.00
|
24.95
|
8.10
|
36.80
|
1.48
|
0.68
|
|
RS
|
1,353.31
|
0.00
|
236.25
|
162.10
|
242.09
|
1.02
|
0.45
|
|
CL
|
2,996.58
|
0.00
|
154.27
|
80.68
|
294.79
|
1.91
|
0.63
|
|
PREE
|
1,065.91
|
0.00
|
84.52
|
50.38
|
122.88
|
1.45
|
0.62
|
|
PRIE
|
3,059.82
|
0.00
|
109.67
|
32.60
|
321.14
|
2.93
|
0.77
|
|
SECE
|
506.40
|
0.00
|
11.96
|
0.00
|
47.76
|
3.99
|
0.85
|
|
SP
|
866.56
|
0.00
|
199.61
|
154.68
|
145.30
|
0.73
|
0.36
|
Source: Authors’ calculation, based on the data from the Report on expenditure according to functional classification (Form RAS-functional) for 2018.
|
Max
|
Min
|
Average
|
Median
|
Standard deviation
|
Coefficient of variation
|
Gini
coefficient
|
|
GPS
|
15,242.75
|
0.00
|
1,210.30
|
978.76
|
1,085.52
|
0.90
|
0.36
|
|
FF
|
2,038.27
|
0.00
|
124.80
|
91.22
|
143.52
|
1.15
|
0.47
|
|
RT
|
9,148.88
|
0.00
|
476.06
|
226.20
|
821.28
|
1.73
|
0.67
|
|
WM
|
2,013.74
|
0.00
|
89.65
|
5.07
|
248.62
|
2.77
|
0.85
|
|
CD
|
8,889.66
|
0.00
|
533.39
|
152.55
|
995.92
|
1.87
|
0.73
|
|
SL
|
3,061.17
|
0.00
|
174.92
|
107.95
|
240.40
|
1.37
|
0.57
|
|
HLT
|
408.36
|
0.00
|
16.21
|
0.00
|
35.00
|
2.16
|
0.77
|
|
RS
|
1,645.77
|
0.00
|
109.01
|
62.58
|
165.75
|
1.52
|
0.59
|
|
CL
|
5,968.96
|
0.00
|
124.16
|
36.00
|
439.87
|
3.54
|
0.77
|
|
PREE
|
3,199.89
|
0.00
|
172.37
|
81.84
|
264.46
|
1.53
|
0.64
|
|
PRIE
|
1,366.24
|
0.00
|
48.63
|
24.35
|
98.95
|
2.03
|
0.67
|
|
SECE
|
314.24
|
0.00
|
15.57
|
0.00
|
33.66
|
2.16
|
0.81
|
|
SP
|
10,840.23
|
0.00
|
226.21
|
126.43
|
563.77
|
2.49
|
0.54
|
Source: Authors’ calculation, based on the data from the Report on expenditure according to functional classification (Form RAS-functional) for 2018.
Note: Dec +: LGUs that took over the decentralized functions, Dec –: LGUs that did not take
over the decentralized functions. Source: Authors’ calculation, based on the data from the Report on expenditure according to
functional classification (Form RAS-functional) for 2018.
|
Function
|
Decentralized to
|
|
Primary
education
|
20 counties and the City of Zagreb, as well as 35 other cities with
stronger fiscal capacities
|
|
Secondary
education
|
20 counties and the City of Zagreb
|
|
Social
care–social welfare centers
|
20 counties and the City of Zagreb
|
|
Homes for the elderly and infirm
|
17 counties and the City of Zagreb*
|
|
Health
care
|
20 counties and the City of Zagreb
|
|
Firefighting–public
fire departments
|
76 public fire departments co-owned by LGUs
|
Note: * In three counties (Virovitičko-podravska, Zagrebačka and Krapinsko-zagorska) there are no homes for the elderly and infirm founded by the state nor the LRGUs. Source: Decisions on minimum financial standards for individual public functions (OG 128/19).
Source: Annual regulations on the financing of decentralized functions and the calculation of the
amount of equalization grants for decentralized functions of LRGUs from 2014 to 2020.
Source: Ministry of Finance – Analytical report of the Budget from 2017 to 2020.
|
Decentralized function
|
Tier of government
|
Gini coefficient
before equalization
|
Gini coefficient
after equalization
|
|
Firefighting
|
Local
|
0.284
|
0.454
|
|
Primary education
|
Local
|
0.186
|
0.185
|
|
Primary education
|
Regional
|
0.329
|
0.148
|
|
Secondary education
|
Regional
|
0.230
|
0.097
|
|
Social welfare centers
|
Regional
|
0.233
|
0.202
|
|
Nursing homes
|
Regional
|
0.219
|
0.262
|
|
Health care
|
Regional
|
0.230
|
0.184
|
|
Decentralized function
|
Tier of
government
|
Minimum
standard
|
Collected from
the PIT
|
Equalization grant for dec. functions
|
|
Firefighting
|
Local
|
314.9
|
97.2
|
223.8
|
|
Primary education
|
Local
|
353.3
|
162.8
|
190.5
|
|
Primary education
|
Regional
|
649.8
|
158.9
|
491.0
|
|
Secondary education
|
Regional
|
438.1
|
161.4
|
276.6
|
|
Social welfare centers
|
Regional
|
96.1
|
30.4
|
65.8
|
|
Nursing homes
|
Regional
|
164.5
|
67.1
|
111.3
|
|
Health care
|
Regional
|
387.9
|
125.7
|
267.0
|
|
Total
|
2,404.6
|
803.5
|
1,626.0
|
|
|
|
Abstract
Revenue sharing arrangements and the fiscal equalization system in Croatia have
long been perceived as inadequate and ineffective. The reform of personal income
tax sharing implemented in 2018 was accompanied by a new fiscal capacity
equalization system. To date the effects of these reforms have not been empirically
analyzed. In addition, the impact of the omission of differences in expenditure
needs in the new formula has not been adequately analyzed either. This paper
aims to fill those gaps by analyzing the existing disparities in fiscal capacity and
expenditure needs across subnational governments in Croatia, testing the effectiveness of the current fiscal equalization mechanisms. Using Gini coefficients and
other inequality measures we confirm that the new fiscal equalization does reduce
disparities in per capita fiscal capacity. However, its equalizing effectiveness regarding expenditure needs arising from decentralized functional responsibilities remains overall rather weak.
Keywords: equalization transfers; fiscal capacity; expenditure needs; intergovernmental fiscal relations; Croatia
JEL: H73, D63
1 Introduction
Fiscal equalization at the subnational level has not been widely researched in Croatia. Just a few scientific papers have been devoted to this topic. Bajo and Bronić ( 2007) made one of the first contributions by showing empirically that the allocation of fiscal equalization instruments in Croatia was not associated with the fiscal capacities of local government units (LGUs), and conjecturing that the fiscal equalization system had not been effective. Bronić (2008, 2010) went a step further and empirically confirmed these conjectures, but only at the county (regional) level. Later, Primorac (2014) confirmed that the then-existing model of fiscal equalization was also ineffective at the level of LGUs, i.e., cities and municipalities. However, all this work has been focused mostly on the equalization of fiscal capacity, whereas the disparities in expenditure needs have been mostly neglected. At that time, the equalization of fiscal capacities relied on two main fiscal instruments – tax sharing and the disbursement of several types of grants. Surprisingly, the criteria for applying these instruments were predominantly based on geographical or historical features (based on the beneficial status of the so-called areas of special national concern – ASNC, hill and mountain areas – HMA, islands, etc.)1, and not so much on economic and fiscal features.2 2007) made one of the first contributions by showing empirically that the allocation of fiscal equalization instruments in Croatia was not associated with the fiscal capacities of local government units (LGUs), and conjecturing that the fiscal equalization system had not been effective. Bronić (2008, 2010) went a step further and empirically confirmed these conjectures, but only at the county (regional) level. Later, Primorac (2014) confirmed that the then-existing model of fiscal equalization was also ineffective at the level of LGUs, i.e., cities and municipalities. However, all this work has been focused mostly on the equalization of fiscal capacity, whereas the disparities in expenditure needs have been mostly neglected. At that time, the equalization of fiscal capacities relied on two main fiscal instruments – tax sharing and the disbursement of several types of grants. Surprisingly, the criteria for applying these instruments were predominantly based on geographical or historical features (based on the beneficial status of the so-called areas of special national concern – ASNC, hill and mountain areas – HMA, islands, etc.)1, and not so much on economic and fiscal features.2
Building on these empirical findings, but based on well-known international contributions (such as Martinez-Vazquez and Timofeev, 2008; Spahn, 2007; Shah, 2007; Boadway, 2004, 2007; Dafflon, 2007; Buchanan and Wagner, 1970; Rao, 2007; Slack, 2007 and Vigneault, 2007), Primorac ( 2014) called for the restructuring of the fiscal equalization system in Croatia, proposing “ …a system of partial equalization of fiscal capacities through equalizing the potential revenues from the personal income tax (PIT) and surtax (assuming the maximum surtax rates) and thus putting all local and regional government units (LRGUs) on an equal footing in financing capacity (excepting the City of Zagreb). Equalization is to be carried out vertically – through current general (unconditional) grants from the central government budget.”
A variation of this model was actually implemented in 2018 through the amendment of the Law on Financing of Local and Regional Self-Government Units (OG 127/17). That was accompanied with a wider tax reform, with a simpler, more understandable and generally fairer system of distribution of PIT revenues, implemented by applying a uniform allocation scheme for all LRGUs. The main goal of this paper is to test the effectiveness of the new fiscal equalization model and identify potential areas for improvement. Furthermore, keeping in mind that the system has been restructured only from the point of view of fiscal capacity equalization, the paper examines the need and possibilities for restructuring the fiscal needs side of the equalization system as well.
The equalization of fiscal needs in Croatia has been implemented only for the newly decentralized functions (elementary education, secondary education, social welfare, healthcare and firefighting – all functions that were decentralized after 2001) through setting minimum financial standards and disbursing equalization grants for those decentralized functions. 3 However, the effectiveness of this system has never been thoroughly researched. One question examined in this paper is the need for introducing a more comprehensive system of expenditure needs equalization. That is, a system that would include not only the newly decentralized functions but also other services for which LRGUs have been traditionally responsible. We do that from the perspective of the fiscal gap approach, which considers both the disparities in fiscal capacity and expenditure needs. 4 An important effect of including the broader scope of subnational public services is that the new equalization system that includes expenditure needs would apply to all LRGUs and not only to those few (with stronger capacities) that took over the newly decentralized functions.
In order to examine the need for mitigating inequalities in fiscal needs between LRGUs, we calculate fiscal inequalities in per capita expenditure for the most prominent public services for counties, cities and municipalities. Over the years, numerous authors have used a variety of numerical, as well as graphical, methods for measuring fiscal disparities or inequalities across local governments (see, for example, Bird and Tarasov, 2002; Portnov and Felsenstein, 2010 and Cowell, 2009 for the elaboration of some of those measures). Overall, Gini coefficients (Gini, 1912, 1921) and Lorenz curves (Lorenz, 1905) turned out to be the most common tools used in the empirical literature (see, for example, Shankar and Shah, 2003; Blöchliger, 2014; UN-Habitat, 2012; Hierro, Atienza and Patiño, 2007 and Spiezia, 2003). We will also employ these measures to analyze fiscal inequalities in Croatia.
The rest of the paper is organized as follows. The second section describes the current system of revenue assignments and tax sharing arrangements. The third section is devoted to analyzing the effectiveness of the current fiscal capacity equalization system in Croatia. Section four reviews the current expenditure assignments and evaluates inequalities in expenditure per capita for selected public functions, while section five analyzes the effectiveness of the current equalization grants for decentralized functions. Section six concludes and contains policy implication and recommendations.
2 Revenue and tax sharing
The LRGU financing system in Croatia is still developing. Since 2001, when the fiscal decentralization process formally began, LRGU revenue has increased significantly – from 4.8% of GDP in 2000 to 7.6% of GDP in 2020 (figure 1). Current revenues, as expected, mainly dominate the structure of total LRGU revenue, with the share of capital revenues from the sales of non-financial assets almost being negligible. By far the most significant source of LRGU revenue is from taxes (accounting for almost 60 percent of total), followed by administrative fees and user charges (over 15 percent) that relate primarily to utility fees and contributions. Grants or transfers (received) also have a significant share of over 15 percent. Other categories of revenue are less significant (together with revenues from the sale of non-financial assets, they amount to about 10 percent of total LRGU revenue). The fragmented institutional arrangement between larger and smaller units and relatively richer or poorer areas in terms of tax bases has largely been reflected in the LRGU financing systems. Unsurprisingly, the adequacy of current revenue assignments differs significantly across units.
With a combined share of almost 90 percent, PIT (which is basically a central government tax with shared revenues distributed to LRGUs based on a defined tax sharing schedule) and surtax are the main sources of LRGUs’ tax revenues (figure 2). Personal income tax became a particularly important source of LRGU financing from 2007 onward. Since then, the central government has entirely renounced its own sharing in any revenue from PIT, but at the same time, it completely (and also very properly) centralized the revenue from corporate income tax (CIT), which had previously been shared among the state, counties, cities, and municipalities.
Figure 1LRGU revenue sources from 2000 to 2020 (in % of GDP) DISPLAY Figure
Figure 2LRGU tax revenue from 2000 to 2020 (in % of GDP) DISPLAY Figure
Currently, the PIT revenue is shared in such a way that 74% belongs to the municipality or city on a derivation basis (or where the tax is collected), 20% goes to the county in which the local government is located, whereas the remaining share of 6% is allocated (also on a derivation basis) to those LRGUs that have taken over the financing of newly decentralized functions, with different percentages for each transferred function. For elementary education, it is 1.9 percent; secondary education, 1.3 percent; social care, 0.8 percent (centers for social care 0.2 percent, nursing homes 0.6 percent); health care, 1.0 percent; and firefighting, 1.0 percent (public fire departments). Importantly, the revenue collected from the additional PIT shares for decentralized functions is earmarked for financing the minimum financial standard for each of these functions. 5
The historical evolution for the general sharing scheme of the PIT is summarized in table 1. It has to be noted that previously, special (favorable or beneficial) tax sharing arrangements existed for LGUs in ASNC and HMA until 2015, as well as for certain LGUs on islands and in what are called supported areas until 2018.
Table 1General PIT sharing scheme (in %) DISPLAY Table
Through these beneficial tax sharing arrangements, the government was trying to mitigate fiscal inequalities. However, the effectiveness of such arrangements was weak because the criteria for granting the preferential treatment within the tax sharing scheme were inadequate from a fiscal equalization perspective. With the amendments to the Law on Financing Local and Regional Self-Government Units (OG 127/17), a simpler, more understandable and generally fairer system of distribution of PIT has been established. All PIT revenue is left to LRGUs, and the distribution of PIT revenue is simplified by applying a uniform allocation scheme for all LRGUs. There are no exceptions and all units are covered with the same (uniform) tax schedule, including those in HMA, ASNC and islands, as well as those in the supported areas that had previously enjoyed preferential treatment in the PIT revenue sharing system.
Also, with the new distribution of the PIT, both the share for financing the equalization grants for the newly decentralized functions and the share for financing the newly established fiscal capacity equalization scheme ceased to exist. The fiscal equalization system is now completely financed from the state budget, and that includes the equalization grants for decentralized functions (since 2018) and the fiscal capacity equalization system (since 2021). The appropriation of 1.5% of PIT for EU projects as well as the shares intended for capital projects for the development of the municipalities and cities in the HMA and islands have been abolished. The funds for these purposes have been provided in the state budget from the general budget revenues since 2018.
3 Fiscal capacity equalization
Due to the different conditions in which individual areas have developed, local and regional self-government units differ in the degree of economic development, in their tax bases, and therefore in their ability to raise revenues from the taxes that have been assigned to them. In other words, not all LRGUs are able independently (without central government assistance) to provide an adequate level of public services to all their citizens (exercising a comparable level of tax collection effort). The LRGU financing system has undergone significant changes in this regard by the amendment of the Law on Financing of Local and Regional Self-Government Units (OG 127/17), when a completely new model of fiscal equalization was created that allowed for greater levels of fiscal equalization, especially among cities and municipalities.
According to the new Law, municipalities, cities and counties whose capacity to generate tax revenue is less than the reference value for the capacity of generated tax revenue become eligible (or exercise the right) to receive fiscal equalization funds. To allocate these funds, three separate equalization systems have been introduced, each for one group (level) of local government units – counties, cities and municipalities. It is important to point out here that the equalization system for reasons of simplicity (that is, avoiding the difficulty of estimating the fiscal capacity or potential revenues from all own revenue sources 7) focuses exclusively on PIT revenue sharing and the surtax. Despite the omission of other own revenue capacity, this approach tends to provide satisfactory results because PIT sharing and the surtax account for about 90% of LRGU total tax revenue. However, since the (omitted) fiscal capacity from own revenues is much more important proportionally for relatively richer jurisdictions, this approach tends to “punish” relatively poorer jurisdictions with lower tax bases, which artificially appear to have relatively higher tax capacity than they really do.
The so estimated (partial) fiscal capacity of LRGUs is based on the five-year average of the potentially collected PIT and surtax per capita that would be achieved if the highest surtax rate was applied. The benchmark (i.e., the reference value of the capacity of generated tax revenue) is selected as the average fiscal capacity per capita of all government units of the same level. In other words – a separate benchmark has been determined for each group of units – counties, cities and municipalities. The City of Zagreb is – due to its disproportionally high fiscal capacity 8 – excluded from the calculation. In addition, the benchmark for municipalities is adjusted (the average fiscal capacity is increased) by 50% to equalize the huge difference of reference values between cities and municipalities in general.
The fiscal equalization model incorporated in the new LRGU financing system is based on several important variables. The funds distributed to LRGUs through the fiscal equalization system are unconditional or non-earmarked revenues (grants from the central government budget), which is a conventional feature of equalization grants in the vast majority of countries. The distribution formula is based on two criteria: (i) the capacity of the generated tax revenue (based on PIT sharing and surtax only), and (ii) the reference value of the capacity of generated tax revenues.
More specifically, the measure of fiscal capacity is calculated for each LRGU as follows.
The capacity of generated tax revenues of a municipality or city is a five-year moving average of revenue from PIT generated in the territory of a municipality or city, as well as from the surtax that a municipality or city would achieve by introducing the highest allowed rate of surtax per capita of each municipality or city: 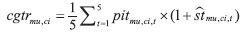 | (1) |
 potential (estimated) surtax that a municipality or city would achieve by introducing the highest allowed rate of surtax per capita in the period t. potential (estimated) surtax that a municipality or city would achieve by introducing the highest allowed rate of surtax per capita in the period t.
The capacity of generated tax revenues of a county is a five-year moving average of revenue from the PIT generated in the individual county, multiplied by the proportion (currently 20%) that belongs to counties based on the distribution of PIT revenue per capita in that county:  | (2) |
where cgtrco denotes the capacity of generated tax revenue of a county per capita, pitco.t per capita revenue from the PIT of a county in the period t.
The reference value of the capacity of generated tax revenues is calculated separately for all municipalities, for all cities, and for all counties as follows.
The reference value of the capacity of generated tax revenues for municipalities is a five-year average of the revenue from PIT generated in all municipalities and of revenues achievable using the highest statutory surtax rate, per capita of all municipalities, which is increased by 50% of the value thus obtained: 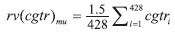 | (3) |
where rv( cgtr) mu denotes the reference value of the capacity of generated tax revenues for municipalities and cgtri the capacity of generated tax revenue of a municipality i.
The reference value of the capacity of generated tax revenues for cities is a fiveyear average of the revenue from the PIT generated in all cities and of revenues achievable using the highest statutory surtax rate, per capita of all cities. 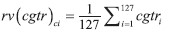 | (4) |
where rv( cgtr) ci denotes the reference value of the capacity of generated tax revenues for cities and cgtri the capacity of generated tax revenue of a city i.
The reference value of the capacity of generated tax revenues for counties is the five-year average of the revenue from the PIT generated in all counties, multiplied by the county share of personal income tax revenue, per capita of all counties. 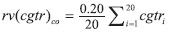 | (5) |
where rv( cgtr) co denotes the reference value of the capacity of generated tax revenues for counties and cgtri the capacity of generated tax revenue of a county i.
Municipalities, cities and counties whose generated tax revenue capacity is lower than the reference value of the generated tax revenue capacity are the only ones entitled to fiscal equalization funds. The full fiscal equalization funds for a particular municipality, city or county represent the difference between the reference value of the capacity of generated tax revenues for municipalities, cities or counties and the capacity of generated tax revenues of each municipality, city or county multiplied by the total population of that municipality, city or county. Again, if the generated tax revenues capacity a particular LRGU is greater than the corresponding reference value of the capacity of generated tax revenues, the unit is not entitled to fiscal equalization funds. 9 The sum of all full fiscal equalization funds is the total value (financing) of the fiscal equalization system, as shown below: 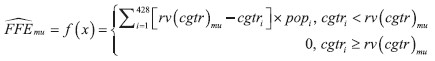 | (6) |
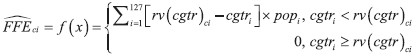 | (7) |
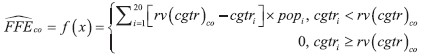 | (8) |
 denote estimates of full fiscal equalization funds for municipalities, cities and counties respectively, rv(cgtr) mu, rv( cgtr) ci and rv( cgtr) co reference values of the capacity of generated tax revenues for municipalities, cities and counties per capita, cgtri per capita capacity of generated tax revenue of a municipality, city or a county i and popi population of a municipality, city or a county i.
The actual amount of fiscal equalization funds that each LRGU will receive depends on the total pool of funds for fiscal equalization FEC determined annually by the decision of the minister of finance. This certainly leaves room for improvement. International practice suggests that the better standard is to use a formula-based approach, for example, as a share of total central government revenues, to automatically determine the pool of available funds. The advantage of this approach is in making the funds predictable (and likely more stable), thus helping the LRGUs to plan their budgets better.
The total amount of funds needed for fiscal equalization is equal to the sum of funds needed for fiscal equalization in the full amount of all LRGUs.  | (9) |
Where  denotes the total estimated funds required for full fiscal equalization of municipalities, cities and counties, and are estimates of full fiscal equalization funds for municipalities, cities and counties respectively.
The share of funds needed for the fiscal equalization of each LRGU in the total sum of the funds needed for the fiscal equalization of all LRGUs represents the share of each unit on the basis of which it will receive the fiscal equalization grant. That is:
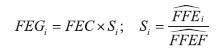 | (10) |
Where FEGi denotes the value of the fiscal equalization grant for a LRGU i, FEC the actual capacity of the fiscal equalization fund and Si the share of LRGU i in the fiscal equalization fund.
The funds to be distributed to each LRGU depend, therefore, on the amount of the share calculated for each LRGU and on the funds available for fiscal equalization – determined each year by the decision of the minister of finance (HRK 2 billion in 2021). In other words, when the total pool of equalization funds is not sufficient to cover all the gaps vis-à-vis particular reference levels, then the available funds are distributed proportionally to the size of the gaps across levels of government (groups of units) and within each level also proportionally to the gap for each jurisdiction. The share of funds required for full fiscal equalization of a municipality, city and county in the total required fiscal equalization funds for all municipalities, cities and counties, as well as the capacity of generated tax revenues and the reference value of the capacity of generated tax revenues, is determined for each fiscal year.
LRGUs that are entitled to the funds of fiscal equalization are allocated a monthly payment (before the 15th day in the current month). As noted above, the equalization transfers are non-earmarked grants from the central government budget. Thus, LRGUs have the freedom to direct the funds received for the purposes they identified as most needed.
Interestingly, for 2020, according to the Ministry of Finance’s calculations, there are only 82 municipalities, 40 cities and 5 counties outside the fiscal equalization system. 10 This confirms, on the basis of the current formula, a significant asymmetry or large disparities in fiscal capacity between local and regional governments with regard to the possibility of providing a comparable level of public services with a comparable tax burden across all LRGUs.
The effectiveness of the new fiscal equalization system in comparison with the old one is presented by Gini coefficients (figure 3). The Gini coefficient is a common measure used to represent (fiscal) inequalities. It ranges from 0 to 1, with 0 indicating complete equality and 1 total inequality. The Gini coefficients compared in the figure 3 are computed for cities, municipalities and counties on the basis of the PIT and surtax, compensatory grants and grants established by the State Budget Execution Law for 2017 (under the old system) and 2018 (under the new system). With the implementation of the new fiscal equalization system, fiscal inequalities in terms of fiscal capacity (defined as currently in the law) have been almost halved at all levels of local and regional public authority.
Figure 3Gini coefficients of the distribution of PIT and surtax and fiscal equalization funds per capita in 2017 and 2018 DISPLAY Figure
The effectiveness of equalization transfers can also be presented graphically with Lorenz curves. Figure 4 shows how the distribution of revenues gets closer to the (diagonal) equal distribution line after the disbursement of equalization transfers.
Figure 4Lorenz curves of disparities in per capita fiscal capacities in 2018 DISPLAY Figure
Although comparisons in figures 3 and 4 give a sense of the relative effectiveness of the new equalization system, the overall results are not completely credible because there might be also other factors influencing different revenue components, for example those currently not being considered in the equalization formula and consequently affecting the computed Gini coefficients. To approximate the presence of this potential issue, table 2 shows various dispersion measures for certain components of LRGU revenues and expenditures. This table enables us to get a better look at what the disparities are with own and shared revenues 11 and how much equalization transfers can reduce those disparities, as well as how these disparities are then maintained or made worse by other transfers.
Table 2Comparative effects on per capita fiscal disparities in 2018 DISPLAY Table
Gini coefficients for all categories of LRGUs (counties, cities and municipalities) significantly decrease with the distribution of the equalization transfers. For counties from 0.138 to 0.088, for cities from 0.336 to 0.233 and from 0.425 to 0.277 for municipalities. This shows that, despite its shortcomings (it ignores, for example, the full fiscal capacity from own revenues), the current fiscal (capacity) equalization system effectively performs a redistributive function. Also of note is that other transfers significantly increase disparities for counties, whereas for cities and municipalities – disparities are, more or less, maintained by other transfers.
These results are confirmed also in figure 5, which shows Gini coefficients of fiscal disparities in per capita current own revenues of LRGUs before and after the distribution of the fiscal equalization funds. Current own revenues referred to here, actually include own revenues and shared revenues from table 2 reduced by revenues from the sale of nonfinancial assets (capital revenue), as these are exceptional revenues LRGUs cannot count on each year.
Figure 5Gini coefficients of the distribution of current own revenues and fiscal equalization funds per capita from 2018 to 2020 DISPLAY Figure
Disparities in LRGU fiscal capacities per capita are significantly reduced after the allocation of the fiscal equalization grants on all levels of government. Moreover, fiscal inequalities (at least from the fiscal capacity perspective) decrease constantly in the observed period each year both before and after the equalization. Whether this is one of the beneficial long-term consequences of the new fiscal equalization system can be confirmed in future research, but the empirical literature covering the experience of other countries has revealed many beneficial as well as several adverse effects of fiscal equalization grants (Lago and Lago-Peñas, 2022). In any case, it might be that the allocation of fiscal equalization grants gives additional fiscal space to otherwise underperforming LRGUs for carrying productive expenditures with a positive impact on their longer-term fiscal capacities.
4 Decentralized functions and expenditure assignments
After the constitutional changes in 2000, the self-governing scope of Croatia’s municipalities, cities, and counties was determined by the application of the general clause for residual powers in expenditure assignments. Contrary to the concept of administrative decentralization adopted in the previous period, the constitutional changes recognized the legal personality and autonomy of subnational authorities in decision making and management of their affairs. State control over LRGUs became limited to verifying the constitutionality and legality of their actions. By introducing the residual powers general clause, according to which the presumption of authority over local affairs is on the side of subnational units, the range of tasks over which LRGUs have jurisdiction became widely defined. Moreover, LRGUs independently dispose of their own income, are authorized to adopt general acts for their independent internal organization and their administrative bodies, and are given the opportunity to cooperate at the national and international levels. Municipalities and cities perform tasks of local importance, and counties perform tasks of regional significance that otherwise are not assigned to state (central government) bodies. This potentially provides a very wide scope of responsibilities.
The process of fiscal decentralization (since 2001) has enabled LRGUs to take on authority for the provision and financing of significant newly decentralized functions, including health care, education, social welfare, and fire protection services, from the central government. The assignment of newly decentralized functions (expenditure responsibilities) to LGUs has not been mandatory but rather voluntary. This has led to an asymmetric assignment, with different cities and municipalities in charge of different services and some regional government (counties) still in charge of providing many services that in other areas or counties have been effectively decentralized. Only a minority of cities (around one quarter) with higher fiscal capacities have taken on these optional functional assignments. Where the LGUs have not taken over the newly (optional) decentralized functions, the tasks are performed by their respective counties. Thus, in another way of looking at it, there has been a de facto upward delegation among those cities and municipalities that decided not to take on certain types of services. Perhaps the most important policy implication of this asymmetric assignment is that Croatia has indeed found a very effective way (if not necessarily the most correct one) of dealing with the lack of administrative capacity of many small fragmented local governments.
The structure of LRGU expenditure by functional budget classification reveals the intensity of performing various functions and service delivery at the subnational level. This is especially helpful in understanding the respective roles of the different tiers of government in the provision of services where there are concurrent or overlapping responsibilities. The largest share of LRGU expenditures, with regard to functions, is for housing and communal amenities and general public (administrative) services (figure 6). The temporal evolution of LRGUs with regard to decentralized functions also reflects the policy changes in assignments and the corresponding sources of financing. Since 2001, the budget items for decentralized functions have increased considerably, as the financing of the major part of education, health care, social protection, and firefighting was transferred to LRGUs.
As noted, amendments to the Law on Financing of Local and Regional Self-Government Units in 2001 and 2003 and amendments to special laws created the legal preconditions for the decentralization of primary and secondary education, social welfare, health, and firefighting functions (public fire departments) to LRGUs. As already mentioned, these (optional) newly decentralized functions are financed through the increased share of PIT revenue allotted to LRGUs (assigned for each function assumed) and also through equalization grants for decentralized functions (in the event that LRGUs cannot meet the minimum financial standards).
Figure 6LRGUs’ functional expenditure from 2000 to 2020 (in % of GDP) DISPLAY Figure
The functional dimension of expenditures reveals evident disparities among LGUs (table 3). It is surprising that the minimum value for all functional expenditure components is zero, though this is usual for certain naturally centralized functions (such as defense). However, it is difficult to believe that in some LGUs, there is no expenditure for such functions as general public services, economic affairs, or housing and community affairs. It is possible that there are problems in recording these values (functional classification of expenditures) in certain LGUs with weaker administrative capacities. Functional expenditure distribution disparities are less pronounced at the regional (county) level.
In order to create a clearer image of inequalities in service provision at the local level, a separate analysis needs to be conducted for each service because the aggregate figures presented above do not reveal much, since several important functions are reported under each category of functional classification. and in addition, in the case of the newly decentralized functions, naturally those jurisdictions without the decentralized functions cannot be compared with those that have taken them on.
With this aim, below we first decompose functional expenditure for counties, cities and municipalities to find the most significant expenditure items, and then proceed with the calculation of inequality measures for these identified functions. Table 4 shows the most significant functional expenditure categories for counties including: general public services, health, primary and secondary education and social protection.
Table 3Summary statistics of LRGUs’ functional expenditure components per capita in 2018 (in HRK) DISPLAY Table
Table 4Expenditure for selected functions for counties in 2018 (as a % of total) DISPLAY Table The share of expenditure for these functions in total functional expenditure of counties reaches almost 53%. Considering their relative importance, but also the fact that their cumulative share in total functional expenditure exceeds 50%, we focused on these five functions to analyze the presence of inequalities in service provision across counties. As a reminder, healthcare, primary and secondary education and social protection are among the newly decentralized functions (together with firefighting, which is in terms of decentralization more relevant for LGUs) that were predominantly assumed by counties. Inequalities measured with the Gini coefficients, but also other indicators, reveal significant disparities among counties in per capita expenditure for three out of five functions: healthcare, primary and secondary education (table 5).
Table 5Summary statistics of per capita expenditure for selected functions of counties in 2018 (in HRK) DISPLAY Table
LGUs (cities and municipalities), given their natural competences, provide a very different set of services. The most significant functions in terms of functional expenditure for cities and municipalities are: general public services, firefighting, road traffic, waste management, community development, street lights, healthcare, recreation and sport, culture, preschool education, primary education, secondary education and social protection. Expenditure for these functions in 2018 made up more than 73% of total functional expenditure for cities and more than 71% for municipalities (table 6).
Table 6Expenditure for selected functions of LGUs in 2018 (as a % of total) DISPLAY Table
Table 7Summary statistics of per capita expenditure for selected functions of cities in 2018 (in HRK) DISPLAY Table
Gini coefficients of inequalities in service delivery measured as per capita expenditure for each of the functions selected in table 6 for cities are presented in table 7. Significant inequalities are present for all functions. The highest Gini coefficient is recorded for waste management (0.74), primary education (0.77) and secondary education (0.85). One main reason for such high values recorded for primary education is that some cities here have assumed the decentralized function of primary education and therefore have (a priori) higher expenditure but they also receive additional financing (PIT share and equalization grants for decentralized functions) for the assumed function. This is relevant also for firefighting services, although the Gini coefficient for firefighting is much lower than for primary education. In order to control for these effects, a separate analysis is later carried out for cities that took over the financing of primary education and firefighting as newly decentralized functions and those that did not.
Before that, we turn to an analysis of disparities in per capita expenditure for selected functions (according to table 6) for municipalities. The Gini coefficients presented in table 8 confirm significant inequalities in service delivery on a local level for municipalities as well. The most pronounced inequalities are observed in per capita expenditure for waste management (0.85) and secondary education (0.81), but very high Gini coefficients are recorded also for healthcare (0.77), culture (0.77) and community development (0.73).
Since 2001, some municipalities have taken the opportunity to assume the financing and provision of firefighting as a newly decentralized function. This is, in fact, the only newly decentralized function that some municipalities have assumed. In line with previous remarks made for cities, a separate analysis has to be conducted for those units that took over the decentralized functions and those that did not to isolate the impact of asymmetry in expenditure assignments. To cope with this problem, figure 7 presents Gini coefficients of per capita expenditure for primary education and firefighting for cities and municipalities, differentiating between these LGUs that took over the newly decentralized functions and those that did not. It turns out that inequalities are a bit lower for primary education for cities when decomposed into those that took over the decentralized functions and those that did not. 12 The analysis performed for the firefighting services shows similar results but only for cities that did not take over the decentralized functions and municipalities that did. For those two groups Gini coefficients are lower after the decomposition than before (when all the units are considered together).
Table 8Summary statistics of per capita expenditure for selected functions of municipalities in 2018 (in HRK) DISPLAY Table
Although the analysis confirms the existence of significant inequalities in per capita expenditures for the provision of selected (among the most important) public services, these results have to be interpreted with caution for several reasons. First, functional expenditures observed here are normalized in per capita terms but some other measures might prove to be more relevant (e.g., per user or per unit of area, i.e., km2 ). Furthermore, the expenditures analyzed include expenditures of LGUs (only) without the expenditures of their budgetary and extrabudgetary users. This means that total expenditure of all institutions involved in providing certain services are not presented here, but only the expenditure (transfer) from LGUs’ budgets. Importantly, some services are also provided by utility companies (local SOEs). Their expenditures are also not included here as they do not appear in the budget. Such – more comprehensive – analysis should be done in future research, striving to include total consolidated (or, at least, aggregated) expenditures from all service providers. Moreover, only the most important (in terms of per capita expenditure) functions have been analyzed here. In the future, the analysis should be further expanded to all other functions. Lastly, given the specifics involved in the provision of each function, a separate analysis should be conducted for each function (or group of functions) with different indicators and criteria for evaluation tailored to each of those functions.
Figure 7Gini coefficients of per capita expenditure for primary education and firefighting of cities and municipalities in 2018 DISPLAY Figure
5 Equalization grants for decentralized functions
No general expenditure needs equalization system exists in Croatia. Nevertheless, the government performs some sort of fiscal needs equalization, but only for the newly decentralized functions. In its decisions on minimum financial standards13, the Government determines the minimum amount of funds to be provided to cover expenditure on the decentralized functions of primary and secondary education, social protection, health care and firefighting. If fewer funds than the amount implied by the minimum financial standards are received from the designated share of PIT for decentralized functions, LRGUs are entitled to equalization grants for their decentralized functions in the amount required to reach the minimum financial standards for every decentralized function assumed.
Although all LRGUs have the right to assume the financing of newly (optional) decentralized functions, practice reveals that the majority of these functions are taken over by counties and the City of Zagreb (table 9). They include secondary education, social protection – social welfare centers, homes for elderly and infirm and health care. Primary education has been decentralized also to 35 cities with the strongest fiscal capacities, whereas firefighting – public fire departments – has experienced widespread decentralization. Public fire departments are usually coowned by LGUs (cities and municipalities) in different proportions and with different numbers of co-founders (e.g., the Zagorje public fire department is coowned by 23 LGUs – 6 cities and 17 municipalities).
Table 9Decentralization of particular public functions in 2020 DISPLAY Table
The Government determines the manner of the financing of decentralized functions and the method of calculating the amount of equalization grants for decentralized functions for each year by the decree. Equalization grants for decentralized functions are provided in the central government budget to the accounts of ministries responsible for primary and secondary education, social welfare, health and firefighting. The overall amount of the planned pooled funds for all decentralized functions from 2014 to 2020 is shown in figure 8.
Figure 8Expected expenditure for decentralized functions from 2014 to 2022 (in % of GDP) DISPLAY Figure
The difference between the minimum financial standards (expected expenditure for decentralized functions) and the amount collected through the designated PIT share for each function is covered from the equalization grants for decentralized functions. The total value of equalization grants for decentralized functions has decreased over time from 0.44% of GDP in 2017 to 0.32% of GDP in 2020 (figure 9). The majority of equalization grants for decentralized functions are devoted to education (almost 60% of total in 2020), whereas the shares for other decentralized functions are more or less equal and amount to slightly above 0.1% of GDP in total.
Figure 9Equalization grants for decentralized functions from 2017 to 2020 (in % of GDP) DISPLAY Figure
In practice there is an asymmetry on how the two sources of financing (PIT shares and specialized equalization grants) actually work. Any “excess” PIT shares are kept. That is, if LRGUs financing the decentralized functions generate more revenue from the PIT share for decentralized functions than the minimum financial standards set, they can use the excess funds to finance decentralized functions taken over in the amount above the minimum financial standards. However, any “excess” specialized equalization grant has to be returned. That is, if LRGUs financing the decentralized functions receive equalization grants for decentralized functions in excess of the amount established by the minimum financial standards, they have to pay the excess funds back to the state budget within the deadline set by the Government. This surplus of funds is the revenue of the state budget.
Similar to the evaluation of the fiscal capacity equalization, the effectiveness of equalization grants for decentralized functions can be assessed by calculating the Gini coefficient of per capita funds collected through the designated share of the PIT for each function and the coefficient after disbursement of the equalization grants for decentralized functions. The Gini coefficients for 2018 are presented in table 10.
Table 10Effectiveness of the fiscal needs equalization system for newly decentralized functions in 2018 DISPLAY Table
The results show that equalization grants for decentralized functions significantly reduce disparities in the provision of primary and secondary education on the regional level. Inequalities are also somewhat reduced in the provision of health care and social welfare centers at the regional and very marginally for primary education at the local level. However, this instrument turns out to increase inequalities when it comes to firefighting at the local level and nursing homes at the regional level. Nevertheless, again, these results have to be interpreted with caution because inequalities are shown in per capita terms, whereas a more appropriate normalization method would be per user, so further research should also analyze that perspective.
In any case, deeper analysis of the amount of equalization grants for decentralized functions, as well as a comparison of this sum with the minimum financial standard and the amount collected through the PIT share for each function (table 11), also reveals other important findings. The total amount of equalization grants for decentralized functions in 2018 appeared to be more than 2 times higher than the amount collected through the PIT share for decentralized functions. This pattern is also pronounced at the level of individual functions. LRGUs collect from 24.5% (for primary education at the regional level) to 46.1% (for primary education at the local level) of the total required revenue (minimum financial standard) through the PIT share for particular functions, whereas the rest comes from the equalization grants for decentralized functions.
This additionally confirms the need to revise the system as it seems that LRGUs are not only faced with the issue of horizontal fiscal inequalities but also vertical fiscal imbalances when it comes to newly decentralized functions. To this end, the government might also consider increasing the PIT shares for decentralized functions as the incentive for assuming the newly decentralized functions appears to be asymmetrical, i.e., the transfer (or decentralization) of expenditure responsibilities is more intense than of the revenue sources.
Table 11Minimum financial standards and equalization grants for newly decentralized functions in 2018 (in HRK million) DISPLAY Table
It is worth repeating here that this analysis should be expanded also to other – and not only the newly decentralized – functions. However, it provides enough evidence for a serious consideration of the inclusion of fiscal needs in the general fiscal equalization formula. The most commonly accepted objective of fiscal equalization is to allow subnational governments to provide to their residents similar levels of access to a standard package of public services when they exercise average levels of tax effort. Our results show that with the (currently partial) equalization of fiscal capacities, this objective might not be achieved, as LRGUs differ in their expenditure needs, in consequence of their different demographic compositions, socioeconomic conditions, or costs of services delivery. International experience provides many different examples of fiscal equalization design where both fiscal capacity and expenditure needs are taken into account.
The state of the art in the design of equalization transfers in the international practice is the “fiscal gap” approach, defined as the difference between estimated expenditure needs and fiscal capacities. An increasing number of countries have adopted this methodology. Among developed OECD countries: Australia, Canada for the Northern Territories, Italy, Japan, Korea, Sweden, United Kingdom, and many U.S. states; among countries in transition: China, Latvia, Russia, Ukraine and Vietnam; and among developing countries: Indonesia, Peru, and Uganda. Closely related, Canada implements equalization for its provinces (as opposed to the territories) only on the basis of fiscal capacity per capita. Germany, Poland and Spain use yet another variation of the methodology by equalizing fiscal capacity per adjusted population (instead of simply per capita), where adjustments to the actual population are made to reflect differences in expenditure needs (Martinez-Vazquez, 2020).
6 Conclusions (policy recommendations and options for reform)
There have been advances in subnational fiscal equalization in Croatia but these reforms need to go further. Although a solid system for mitigating disparities among LRGUs’ fiscal capacity was finally introduced in 2018, further steps towards greater fiscal equalization should be taken, in particular by incorporating the (potential) existing disparities in expenditure needs into the equalization system, as well as by accounting fully for disparities in fiscal capacity (by incorporating measures for potential revenues from all own sources).
In terms of expenditure needs, one approach would be for the central government to determine what public services should be provided by all local and regional units and at what level (quantity and quality), so that the equalization system can guarantee access to an equal or similar level for those services to all citizens regardless of where they live in the country. A second approach would be to determine the minimum financial standards per client for all the services in the list. This second approach is more practical and it has the precedence of the methodology currently being used for the newly decentralized functions. The difficulty may lie in selecting the proper client base and also the financial standard. But for the latter it would be possible for example to start with actual historical spending per capita. Currently, a comparison of the service provision for many of those functions reveals that there are significant disparities or unevenness among municipalities, cities and counties. Moving forward, it would be necessary to determine the affordable (in budgetary terms) minimum standards of public services to which all citizens are entitled, at least in the forms of minimum financial norms per client (main service users), so that there are no large disparities or more generally unequal coverage or access to public services in different LRGUs, with different staffing and financial opportunities.
Currently, despite the equalization in fiscal capacity, there is still a big difference in the provision of public services, pointing to the need for the introduction of expenditure fiscal needs in the equalization system side by side with fiscal capacity equalization and also the need to account fully for disparities in fiscal capacity by incorporating measures for total potential own revenues. This will not be an easy task. The minimum financial standards should be affordable within existing overall budget constraints; that is, they should correspond to the fiscal reality of the country, and only revised over time as the overall financing and budget constraints allow it. However, there is a wealth of methodologies and experiences at the international level to quantify expenditure needs, from which Croatian authorities could draw to implement these reforms. There is also a variety of methodologies that can be used to measure potential own revenues.
The fiscal equalization system is currently faced with a lack of clarity in the design and effects of a fiscal needs equalization/distribution formula (calculating minimum financial standards, etc.). A sequenced reform should be put in place in order for the system to evolve and mature in line with EU/OECD country experiences. The initial phase could include studying the reform of the equalization grants to include expenditure needs equalization by means of either adopting the fiscal gap approach to equalization or the fiscal capacity per adjusted population approach (where the adjusted population reflects differences in expenditure needs). The inclusion of the expenditure needs and the full measure of fiscal capacity of LRGUs would bring the current equalization system closer to the best international practices and ensure more equitable outcomes in terms of access to basic public services by Croatian citizens.
Annex
CRITERIA FOR DETERMINING THE MINIMUM FINANCIAL STANDARDS FOR DECENTRALIZED FUNCTIONS The criteria for determining the minimum financial standards for decentralized functions are determined each year by the Government’s decision for each function. Below, we provide the extracts from decisions setting the criteria for decentrlaized functions for 2020.
FIREFIGHTING LGUs that are the founders and co-founders of public fire departments provide funding for employees and for material and financial expenditures. According to the Decision on Minimum Financial Standards for Performing the Activities of Public Fire Brigades in 2020 (OG 128/2019), the minimum financial standard for 2020 is set at a total of HRK 341,484,990. The criteria and benchmarks for setting minimum financial standards as a basis for planning grants for the decentralized function of firefighting to the founders and co-founders of public fire brigades in 2020 are: - fixed assets – fixed allowance (20 percent of the total amount);
- classification of the unit according to vulnerability, capability, and resilience (20 percent);
- number of inhabitants in the area of the founder and co-founder that the fire brigade can reach in 15 minutes (25 percent);
- the area of the founder and co-founder that the fire brigade can reach in 15 minutes (5 percent);
- current average of financing from 2003 to 2019 (25 percent);
- other risks, additional activities on command, and correction for personal protective equipment (5 percent).
HEALTH CARE The Decision on Minimum Financial Standards for Decentralized Functions for Health Care Institutions in 2020 (OG 128/2019) sets minimum financial standards for: - investment of health care institutions in premises, medical and non-medical equipment, and means of transport;
- investment and current maintenance of health care institutions: premises, medical and non-medical equipment, and means of transport;
- informatization of health care.
The minimum financial standard for 2020 is set at a total of HRK 407,549,130. The amount of funds allocated to an individual county, plus the City of Zagreb, is determined by applying the following criteria: - the share of the number of insured persons in each county, plus the City of Zagreb, in relation to the total number of insured persons with the Croatian Health Insurance Institute (75 percent of the total amount);
- the share of the number of locations where health care activities take place in each county (and Zagreb) in relation to the total number of locations in Croatia (10 percent);
- the share of the number of health care institutions in each county (and Zagreb) in relation to the total number of health care institutions that have a contract with the Croatian Health Insurance Institute (5 percent);
- the share of the number of contracted beds in each county (and Zagreb) in relation to the total number of contracted beds with the Croatian Health Insurance Institute in Croatia (5 percent);
- corrective criterion: the inclusion of projects of priority importance to raising the availability of health care or completing the started investments, taking into account the share of investments in the health care institutions (premises, medical and non-medical equipment, and means of transport) of counties from the state budget in previous years (5 percent).
PRIMARY EDUCATION The Decision on the Criteria for Determining Balance Sheet Rights 14 for Financing the Minimum Financial Standard for Public Needs of Primary Education in 2020 (OG 128/2019) determines total balance sheet rights of LRGUs for: - material and financial expenditures;
- expenses for materials and parts for current and investment maintenance, current and investment maintenance services;
- expenditures for the acquisition of produced fixed assets and additional investments in non-financial assets.
The amount of funds allocated to an individual county, plus the City of Zagreb, is determined by applying the following criteria: - For material and financial expenditures: the amount of these expenditures determined in 2019 (OG 2/2019), in accordance with the Economic and Fiscal Policy Guidelines for the period 2020-22 and the Budget Guidelines for LRGUs for the period 2020-22.
- For expenditures for current and investment maintenance: the number of students, classrooms, and school buildings in the school year 2019/20, based on average calculation prices as follows: per student HRK 62.00 per year, per class department HRK 1,032.77 per year, and per school building HRK 7,564.08 per year.
- For expenditures for the acquisition of produced fixed assets and additional investments in non-financial assets: the number of students, classrooms, and school buildings in the school year 2019/20, based on average calculation prices as follows: per student HRK 189.65 per year, per class department HRK 3,158.95 per year, and per school building HRK 4,990.19 per year.
SECONDARY EDUCATION The Decision on Criteria for Determining Balance Sheet Rights for Financing the Minimum Financial Standard of Public Needs of Secondary Schools and Student Dormitories in 2020 (OG 128/2019) determines total balance sheet rights for counties and the City of Zagreb for: - material and financial expenditures;
- expenditures for materials and parts for current and investment maintenance and current and investment maintenance services;
- expenditures for the acquisition of produced fixed assets and additional investments in non-financial assets.
The amount of funds allocated to an individual county, plus the City of Zagreb, is determined by applying the following criteria: - For material and financial expenditures: amount of these expenditures determined in 2019 (OG 2/2019), in accordance with the Economic and Fiscal Policy Guidelines for the period 2020-22 and the Budget Guidelines for LRGUs for the period 2020-22.
- For expenditures for current and investment maintenance: the number of students, classrooms and school buildings in the school year 2019/20, based on average calculation prices as follows: per student HRK 64.74 per year, per class department HRK 1,246.62 per year and per school building HRK 11,553.76 per year for secondary schools and HRK 492.23 per year per student for dormitories.
- For expenditures for the acquisition of produced fixed assets and additional investments in non-financial assets: the number of students, classrooms and school buildings in the school year 2019/20, based on average calculation prices as follows: per student HRK 177.91 per year, per class department HRK 3,425.65 per year and per school building HRK 6,847.83 per year.
The criterion for determining the balance sheet rights for co-financing in student dormitories in counties and the City of Zagreb is the number of students enrolled in the school year 2019/20. The measure is the average price of HRK 6,300 per student for I-IV class.
SOCIAL CARE – SOCIAL WELFARE CENTERS The Decision on Minimum Financial Standards and Criteria for Financing Material and Financial Expenditures of Social Welfare Centers and Firewood Costs for Users Heating with Wood in 2020 (OG 128/2019) sets minimum financial standards for counties and the City of Zagreb for material and financial expenditures of social welfare centers headquartered in their area. The criterion for material and financial expenditures is the number of employees in the social welfare center. The measure is the average monthly amount of funds per worker. Counties and the City of Zagreb provide funds for firewood costs to users heating with wood. The criterion for the expenditure of heating costs is the number of users planned in 2019. The measure is the amount of HRK 1,050 per user.
HOMES FOR THE ELDERLY AND INFIRM (NURSING HOMES) The Decision on Minimum Financial Standards and Criteria for Decentralized Financing of Homes for the Elderly and the Infirm in 2020 (OG 128/2019) sets minimum financial standards for counties and the City of Zagreb for expenditures for employees, material and financial expenditures, and expenditures for the acquisition of non-financial assets and emergency interventions.
Criteria for financing expenditures for employees are determined by the number of employees, that is, per beneficiary (of permanent accommodation, adjusted coefficient of 20 percent for beneficiaries of home help and delivery and preparation of meals for external beneficiaries), according to: - a regulation determining the minimum conditions for the provision of social services;
- the law that regulates salaries in public services and, according to the regulation, that determines job titles and coefficients of complexity of jobs in public services;
- the basis for calculating the salary of employees in public services determined by a collective agreement or a decision of the Government of the Republic of Croatia;
- the provisions of the Basic Collective Agreement for Civil Servants and Employees in Public Services and the Collective Agreement for Social Welfare Activities, which apply as legal rules.
The measure for settling material and financial expenditures is the number of beneficiaries.
Criteria for financing the expenditure of non-financial assets are determined per beneficiary according to: - a regulation laying down minimum conditions for the provision of social services;
- the condition of the space and equipment according to the intensity of investment in previous years and investment per beneficiary
The counties and the City of Zagreb secure, per home for the elderly and infirm, HRK 150,000 per year for emergency interventions (investment maintenance, equipment and procurement of non-financial assets).
Notes
* This paper partially builds on the results of the project “Fiscal decentralization in Croatia” (World Bank, 2021)
and more specifically on the main results related to issues of fiscal equalization. However, issues like the existing inequalities in fiscal expenditure needs have been newly added. The authors would like to thank the two
anonymous reviewers for their very useful comments and suggestions. The findings, interpretations, and conclusions expressed in this article are entirely those of the author(s). They
do not necessarily reflect the views of The World Bank, its Board of Executive Directors, or the governments
they represent. Opinions and views in this article do not represent the official position of the Ministry of
Finance of the Republic of Croatia, Inter-American Development Bank, European Bank for Reconstruction
and Development, European Investment Bank, and World Bank.
1 For details see Primorac (2014 and 2015).
2 There are also other significant domestic contributions dealing with similar topics, such as Jurlina Alibegović, Slijepčević and Kordelj-De Villa (2013), Hodžić and Muharemović (2019), Jurlina Alibegović, Hodžić and Bečić (2019), Bronić (2020), Hodžić and Paleka (ref9880#2020), as well as Škarica (2021).
3 A more detailed description of this system is provided in section 5, as much of it is still in operation.
4 Even though the equalization system proposed by Primorac (2014) relied exclusively on mitigating differences in fiscal capacities, it also called for further research with the aim of examining the opportunities and constraints of expanding the system to the equalization of fiscal or expenditure needs.
5 The minimum financial standards and the financing of decentralized functions are further discussed in section 5.
6 Until 2018, funds within this category were used to finance equalization grants for decentralized functions. However, since 2018 the central government has taken over the equalization funding for decentralized functions leaving this share of PIT for funding the newly-established fiscal equalization scheme.
7 Own revenue refers to the revenue from county, city or municipal taxes, administrative fees, user charges, revenue from own property, fines and other own revenue sources.
8 More than one quarter of all LRGUs’ current revenue in 2018 is related to Zagreb. All municipalities and counties combined together generated in the same year slightly more current revenue than Zagreb alone. The divergence of Zagreb’s fiscal capacity (from that of other LRGUs) is significant also in per capita terms. Finally, the unique possibility to introduce surtax of up to 18% (the maximum rate for other cities is 15%) makes Zagreb an outlier in every sense. If Zagreb were included in the calculation of the reference value it would skew the average upwards so most of cities would turn out to be below average.
9 Importantly, there is no Robin Hood (or “fraternal” funding) element in the current fiscal equalization system. LRGUs that are not eligible to receive equalization transfers do not have to contribute any of their “surplus” to the pool of equalization funds.
10 Table of LRGUs’ share for fiscal equalization in 2020 is available here.
11 Shared revenues refer here to the PIT revenue (both the PIT revenue collected according to a uniform sharing scheme and the additional part of the PIT revenue for the optional decentralized functions taken over).
12 Note that even those LGUs that did not formally take over the decentralized functions (primary education and firefighting) still show expenditures according to the functional classification for these functions. These expenditures are much lower than for those LGUs that took over the decentralized functions and can include, for example, expenditure for voluntary fire brigades, student transportation, smart boards, computers, and other supplies.
13 See Annex for a more detailed presentation of the criteria used for determining the minimum financial standards for each of the decentralized functions.
14 Balance sheet rights are the funds required to ensure minimum financial standards for a particular decentralized function according to decisions on minimum financial standards.
* This paper partially builds on the results of the project “Fiscal decentralization in Croatia” (World Bank, 2021)
and more specifically on the main results related to issues of fiscal equalization. However, issues like the existing inequalities in fiscal expenditure needs have been newly added. The authors would like to thank the two
anonymous reviewers for their very useful comments and suggestions. The findings, interpretations, and conclusions expressed in this article are entirely those of the author(s). They
do not necessarily reflect the views of The World Bank, its Board of Executive Directors, or the governments
they represent. Opinions and views in this article do not represent the official position of the Ministry of
Finance of the Republic of Croatia, Inter-American Development Bank, European Bank for Reconstruction
and Development, European Investment Bank, and World Bank.
1 For details see Primorac ( 2014 and 2015).
2 There are also other significant domestic contributions dealing with similar topics, such as Jurlina Alibegović, Slijepčević and Kordelj-De Villa ( 2013), Hodžić and Muharemović ( 2019), Jurlina Alibegović, Hodžić and Bečić ( 2019), Bronić ( 2020), Hodžić and Paleka (ref9880#2020), as well as Škarica ( 2021).
3 A more detailed description of this system is provided in section 5, as much of it is still in operation.
4 Even though the equalization system proposed by Primorac ( 2014) relied exclusively on mitigating differences in fiscal capacities, it also called for further research with the aim of examining the opportunities and constraints of expanding the system to the equalization of fiscal or expenditure needs.
5 The minimum financial standards and the financing of decentralized functions are further discussed in section 5.
6 Until 2018, funds within this category were used to finance equalization grants for decentralized functions. However, since 2018 the central government has taken over the equalization funding for decentralized functions leaving this share of PIT for funding the newly-established fiscal equalization scheme.
7 Own revenue refers to the revenue from county, city or municipal taxes, administrative fees, user charges, revenue from own property, fines and other own revenue sources.
8 More than one quarter of all LRGUs’ current revenue in 2018 is related to Zagreb. All municipalities and counties combined together generated in the same year slightly more current revenue than Zagreb alone. The divergence of Zagreb’s fiscal capacity (from that of other LRGUs) is significant also in per capita terms. Finally, the unique possibility to introduce surtax of up to 18% (the maximum rate for other cities is 15%) makes Zagreb an outlier in every sense. If Zagreb were included in the calculation of the reference value it would skew the average upwards so most of cities would turn out to be below average.
9 Importantly, there is no Robin Hood (or “fraternal” funding) element in the current fiscal equalization system. LRGUs that are not eligible to receive equalization transfers do not have to contribute any of their “surplus” to the pool of equalization funds.
10 Table of LRGUs’ share for fiscal equalization in 2020 is available here.
11 Shared revenues refer here to the PIT revenue (both the PIT revenue collected according to a uniform sharing scheme and the additional part of the PIT revenue for the optional decentralized functions taken over).
12 Note that even those LGUs that did not formally take over the decentralized functions (primary education and firefighting) still show expenditures according to the functional classification for these functions. These expenditures are much lower than for those LGUs that took over the decentralized functions and can include, for example, expenditure for voluntary fire brigades, student transportation, smart boards, computers, and other supplies.
13 See Annex for a more detailed presentation of the criteria used for determining the minimum financial standards for each of the decentralized functions.
14 Balance sheet rights are the funds required to ensure minimum financial standards for a particular decentralized function according to decisions on minimum financial standards.
Disclosure statement
No potential conflict of interest was reported by the authors.
References
Blöchliger, H., 2014. Fiscal equalisation – a cross-country perspective. Paper prepared for the conference on “Fiscal Equalisation”, Berlin, 26-27 June 2014.
Boadway, R., 2004. The Theory and Practice of Equalization. CESifo Economic Studies, 50 (1), pp. 211-254 [ CrossRef]
Boadway, R., 2007. Grants in a Federal Economy: A Conceptual Perspective. In: R. Boadway and A. Shah. Intergovernmental Fiscal Transfers: Principles and Practice. Washington, D.C.: The World Bank.
Bronić, M., 2008. Utjecaj fiskalnih kapaciteta i potreba na fiskalne nejednakosti hrvatskih županija. Doctoral thesis. Faculty of Economics, University of Zagreb.
Buchanan, J. M. and Wagner, R., 1970. An efficiency basis for federal fiscal equalization. In: J. Margolis, ed. Analysis of Public Output. New York: Columbia University Press, pp. 139-158.
Cowell, F. A., 2009. Measuring Inequality. London School of Economics and Political Sciences, Distributional Analysis Research Programme.
Dafflon, B., 2007. Fiscal Capacity Equalisation in Horizontal Fiscal Equalisation Programs. In: R. Boadway and A. Shah. Intergovernmental Fiscal Transfers: Principles and Practice. Washington, D.C.: The World Bank, pp. 361-397.
Gini, C., 1912. Variabilità e mutabilità: Contributo allo studio delle distribuzioni e relazioni statistiche. Bologna, Tipogr. di P. Cuppini.
Gini, C., 1921. Measurement of Inequality of Incomes. The Economic Journal, 31(121), pp. 124-126 [ CrossRef]
Hodžić, S. and Muharemović, A., 2019. Fiscal Decentralization and Efficiency of Regional Government in Croatia: A Data Envelopment Analysis. Lex localis, 17(3), pp. 453-470.
Hodžić, S. and Paleka, H., 2020. Fiscal Capacities of Large Cities in Croatia – Financial Support for Smart Cities. Naše gospodarstvo, 66(2), pp 42-49 [ CrossRef]
Jurlina Alibegović, D., Hodžić, S. and Bečić, E., 2019. The level of fiscal autonomy: evidence from Croatia, Serbia and Bosnia and Herzegovina. The NISPAcee Journal of Public Administration and Policy, 12(1), pp. 91-112 [ CrossRef]
Jurlina Alibegović, D., Slijepčević, S. and Kordej-De Villa, Ž., 2013. Can Local Governments in Croatia Cope with more Responsibilities? Lex localis, 11(3), pp. 471-495 [ CrossRef]
Lorenz, M. O., 1905. Methods of Measuring the Concentration of Wealth. Publications of the American Statistical Association, 9(70), pp. 209-219 [ CrossRef]
Martinez-Vazquez, J. and Timofeev, A., 2008. Regional – local dimension of Russia's fiscal equalisation. Journal of Comparative Economics, 36, pp. 157-176 [ CrossRef]
Martinez-Vazquez, J., 2020. Emerging trends in fiscal transfer systems in selected federations: implications for India. In: S. Yilmaz and F. Zahir, eds. Intergovernmental Transfers in Federations. Cheltenham; Northampton: Edward Elgar Publishing [ CrossRef]
Portnov, B. A. and Felsenstein, D., 2010. On the suitability of income inequality measures for regional analysis: Some evidence from simulation analysis and bootstrapping test. Socio-Economic Planning Sciences, 44, pp. 212-219 [ CrossRef]
Primorac, M., 2015. The effectiveness of fiscal equalisation in Croatia. Economic
Research - Ekonomska Istraživanja, 28(1), 299-311 [ CrossRef]
Rao, M. G., 2007. Resolving Fiscal Imbalances: Issues in Tax Sharing. In: R. Boadway and A. Shah. Intergovernmental Fiscal Transfers: Principles and Practice. Washington, D.C.: The World Bank, pp. 319-338.
Shah, A., 2007. A Practitioner's Guide to international Fiscal Transfers. In: R. Boadway and A. Shah. Intergovernmental Fiscal Transfers: Principles and Practice. Washington, D.C.: The World Bank, pp. 1-53.
Shankar, R. and Shah, A., 2003. Bridging of Economic Divide within Countries: A Scorecard on the Performance of Regional Policies in Reducing Regional Income Disparities. World Development, 31(8), pp. 1421-1441 [ CrossRef]
Škarica, M., 2021. Process of local government fragmentation in Croatia: From a big-bang to a status quo. Miscellanea Geographica - Regional studies on development, 25(1), pp. 46-53 [ CrossRef]
Slack, E., 2007. Grants to Large Cities and Metropolitan Areas. In: R. Boadway and A. Shah. Intergovernmental Fiscal Transfers: Principles and Practice. Washington, D.C.: The World Bank, pp. 453-481.
Spahn, P. B, 2007. Equity and Efficiency Aspects of Interagency Transfers in a Multi-government Framework. In: R. Boadway and A. Shah. Intergovernmental Fiscal Transfers: Principles and Practice. Washington, D.C.: The World Bank, pp. 75-106.
Spiezia, V., 2003. Measuring regional economies. Statistics Brief No.6.
Vigneault, M., 2007. Grants and Soft Budget Constraints. In: R. Boadway and A. Shah. Intergovernmental Fiscal Transfers: Principles and Practice. Washington, D.C.: The World Bank, pp. 133-171.
World Bank, 2021. Fiscal Decentralization in Croatia. Washington: The World Bank Group.
|
|
|
December, 2022
IV/2022
|


