|
|
|
Abstract
The paper examines the risk-adjusted performance of pension funds for six countries
based on country-level Sharpe ratios. Four of the countries are former transition
economies (Croatia, Slovakia, Romania, and Bulgaria), which, together with Sweden,
comprise the EU member states in the dataset. Chile is added as the sixth, non-EU
member country to provide a more internationally balanced sample. Based on monthly
data for the period from July 2015 to December 2024, the statistical significance of
differences in Sharpe ratios is tested for the same risk-categories across countries and
between risk-categories within each country. The Jobson-Korkie-Memmel, Opdyke
and Ledoit-Wolf tests are performed. The results of empirical analysis suggest that the
performance of pension funds in both A and B risk-categories is statistically significantly different only in instances when pairwise testing involves Croatia. When comparing risk-categories A and B within each country, a statistically significant difference is found only in Bulgaria.
Keywords: risk-adjusted performance; risk categories of pension funds; transition economies; statistical significance tests
JEL: G23, G28
1 Introduction
The performance of pension funds is always scrutinised both by the general public and in academic circles, given the numerous potential concerns which warrant research and discussion. Frequent research topics, therefore, range from analysing the problem of their underfunding or retirement income inadequacy risk (see, for instance, Giron et al.,  2018) to (outrage by) fees being charged for their management (see, for instance, Dyck, Manoel and Morse, 2022). However, an even broader view can easily incorporate the pension system design which then includes the discussions about whether pension funds should be privately or publicly managed, whether there should be more than just one pension fund, and other critiques of the pension reform conducted around the world1, most notably by ILO (2018). All of the above only adds to the general concern for the prudent management of pension funds’ assets, which is why the industry is heavily regulated with investment constraints in place. Thus, pension funds cannot make fully discretionary decisions on how to allocate the assets under management. However, regulatory rules differ across countries and may also vary within a country, depending on the targeted exposure of different types of pension funds. 2018) to (outrage by) fees being charged for their management (see, for instance, Dyck, Manoel and Morse, 2022). However, an even broader view can easily incorporate the pension system design which then includes the discussions about whether pension funds should be privately or publicly managed, whether there should be more than just one pension fund, and other critiques of the pension reform conducted around the world1, most notably by ILO (2018). All of the above only adds to the general concern for the prudent management of pension funds’ assets, which is why the industry is heavily regulated with investment constraints in place. Thus, pension funds cannot make fully discretionary decisions on how to allocate the assets under management. However, regulatory rules differ across countries and may also vary within a country, depending on the targeted exposure of different types of pension funds.
As presented by Brinson, Singer and Beebower ( 1991), a fund’s return can generally be explained by three components: the investment strategy (asset allocation policy), the timing of investment decisions (market timing), and security selection. This approach is followed, for instance, by Blake, Lehmann and Timmermann ( 1999) and Andonov, Bauer and Cremers ( 2012), with Broeders and de Haan ( 2020) adding a fourth component, benchmark selection, to better describe a fund’s realized return.
Taking into account the general principles of institutional money management, as well as the scrutiny and regulation related to the specificities of pension funds, in this research, the main goal is to test whether there are statistically significant differences in the risk-adjusted performance of the mandatory pension funds. The focus of this paper is on the former transition economies which participated in the reform of the pension system leading to the introduction of the fully-funded pension system pillar. Since the former transition economies in the sample have all been EU member states for more than ten years, they share not only broadly similar pension reform blueprints but also comparable structural features which enable easier comparison of the pension funds risk-categories performance. By comparing the performance of risk-categories A and B across countries, the research provides insight both regarding the existence of the differences within the same risk-category and between the two categories. The research findings are not only important from the regulatory policy perspective but are also related to other research efforts focusing on efficient portfolio diversification, i.e., advances in asset allocation for the institutional investors.
2 Literature review
Analysis of pension funds’ asset management can be placed in the context of financial research dealing with topics commonly related to institutional investors. Typically, therefore, a broad overview of research would include efficient portfolio diversification studies such as those by Amenc and Goltz (2013), Amenc et al. (2014), Cesarone, Scozzari and Tardella (2020) and Martellini and Milhau (2018), highlighting the need, on the one hand, for efficient exposure to different sources of systematic risk and, on the other, for effective elimination of idiosyncratic risk. In this context, the exact exposures to specific asset classes may vary substantially, while the ongoing ability to diversify efficiently is oriented towards maximising return per unit of risk in the portfolio. In this regard, Giron et al. (2018), in their analysis of retirement savings portfolio allocation, emphasize that bonds, relative to equities, will not provide the desired protection because managers may be unable to react to market changes. Anarkulova, Cederburg and O’Doherty (2025) go further, arguing that all retirement savings should be invested in equities, with 50% allocated to the domestic (U.S.) market and 50% to other markets, adding arguments in favour of the growing consensus on the so-called “death of the policy portfolio”.
There are also specific topics related to retirement investing, focusing not just on the accumulation stage of the retirement investing problem but on providing the complete solution to the pension fund beneficiaries. The solution to the decumulation problem has been closely examined in the papers proposing retirement bonds, such as Kobor and Muralidhar ( 2018), and also in papers like Martellini, Milhau and Mulvey ( 2019) suggesting that smart target dates strategies can outperform what is currently being offered in the market. The recent performance of risk-categories A, B and C pension funds, for instance in Croatia, provides empirical evidence in support of this strand of research since the risk-category C pension funds were affected by the inflation outburst in 2022 the most and were the slowest to recover in the following years. In other words, the manifestation of a rare combination of factors 2 resulted in risk-category A (considered the riskiest category) outperforming both B and C risk-categories during the fall in 2022 and during the following recovery years. 3 Thus, as pointed out by Martellini ( 2016) efficient diversification should be used in order to maximise the Sharpe ratio, i.e., maximise the return per unit of risk of the portfolio, but hedging is the appropriate risk management technique that should be used to protect the portfolio in times of crisis.
Other strands of research can primarily be classified into two groups. The first one, related to the countries that have introduced a fully-funded pension system pillar through pension reform, is concerned with whether the pension funds’ management was able to deliver the expected risk-adjusted returns for the citizens. Such studies include research like the one performed by Mittelstaedt and Olsen ( 2003) for Chile, De la Torre Torres et al. ( 2015) for Mexico, Kompa and Witkowska ( 2015) for Poland, and Novaković ( 2015) for Croatia. The second one includes conducting cross-country studies encompassing research questions beyond the skill of a pension fund manager. Within this group, the work of Antolin ( 2008), Walker and Iglesias-Palau ( 2010) and Foo and Witkowska ( 2016) provide overviews of pension funds’ performance in the US, Europe and OECD countries while discussing the role of regulation, investment strategies and even market structure when exploring the risk-adjusted performance differences across countries. Studies by Bohl, Lischewski and Voronkova ( 2011) and Kupčík and Gottwald ( 2017) also analyse the risk-adjusted performance in multiple countries, focusing on the assessment of differences and sources of outperformance. Also, Boon et al. ( 2014) and Boon et al. ( 2018) study a multi-country panel dataset and focus on the assessment of regulation on pension fund performance by employing panel regression models. Lastly, Afanador, Davis and Pedraza Morales ( 2021) focus on the effects of international diversification on performance, relying on the CAPM-based approach, showing that it increases returns, albeit with higher risk. Although there are economic reasons for “home bias,” i.e., a preference for domestic investments, the study suggests that it is often driven by regulatory barriers and limited availability of instruments, which hinder international diversification. The paper, among other cases, analyses portfolios and returns in Bulgaria, Romania, Slovakia, and Chile, concluding that pension funds in Slovakia have the highest share of foreign investments, that this share is lower in Bulgaria and Romania, and that it is optimal in Chile.
All the above-mentioned research relies, among other risk-adjusted performance measures, on the Sharpe ratio. However, none of the research papers performing cross-country studies analyse the statistical significance of the Sharpe ratio differences by employing the testing methodology which is commonly used in research papers analysing the performance of investment funds, e.g., mutual funds and hedge funds. Papers, for instance, by Eling and Faust ( 2010) and Auer and Schuhmacher ( 2013) employing the Ledoit-Wolf and Jobson-Korkie-Memmel tests can be considered as such examples. Therefore, the contribution of this paper to the existing literature is twofold. On the one hand, this research follows Boon et al. ( 2014) in using the country-level aggregate pension funds’ Sharpe ratios but employs the Jobson-Korkie-Memmel, Opdyke and Ledoit-Wolf tests in order to test the statistical significance of risk-adjusted performance of pension funds in the analysed countries. In this sense, this paper improves the analysis of pension funds’ performance presented in the papers of, for instance, Bohl, Lischewski and Voronkova ( 2011) and Kupčík and Gottwald ( 2017). On the other hand, this paper improves the performance analysis not just by adding the statistical testing methodology but by conducting the analysis on a data sample which resembles the approach by Afanador, Davis and Pedraza Morales ( 2021).
The aim of the paper is, therefore, to compare the risk-adjusted performance of pension funds within the EU member states and particularly in the case of today’s EU member states which belong to the group of former EU transition economies. Given that the sample in this study focuses on the transition economies (Slovakia, Romania, Bulgaria and Croatia), the potential findings related to differences in the pension funds’ performance can in this case be more easily explained. Namely, considering the comparable legal frameworks, social protection arrangements, and the role and design of mandatory funded pension schemes, the potential differences for the same risk-categories of pension funds can be attributed mostly to the investment strategies employed or to the quality of management, which is an attempt to improve on the challenges discussed by Walker and Iglesias-Palau ( 2010) in their research. Moreover, in order to test whether there are performance differences between the pension funds of EU and non-EU countries, Chilean pension funds were included in the research sample. Also, the EU sample contains data on Swedish pension funds with Sweden being an EU member country that has not adopted the euro nor is it expected to adopt it in the foreseeable future. Thus, aside from Chilean funds, Swedish and Bulgarian 4 pension funds operate from outside the euro area, therefore making their Eurozone investments more international than in the case of the rest of the EU sample. Any detected performance differences between the pension funds from countries included in the sample can also be discussed in this context, following the research by Afanador, Davis and Pedraza Morales ( 2021). Also, in relation to the previous research, by comparing the risk-adjusted performance between different risk-categories of pension funds, this study provides additional evidence regarding the potential change in the regulatory framework as suggested by Anarkulova, Cederburg and O’Doherty ( 2025) and Giron et al. ( 2018).
3 Data and methods
3.1 Data
As already explained in the previous section, the selection of countries included in the analysis was based on the objective of analysing pension systems that share comparable structural features and a common history of pension reform. According to assessments by international financial institutions and organisations, such as the World Bank (see, for instance, Hinz et al. (2010); OECD (2023), ILO (2018) and additionally supported by “pension maps” presented in Schneider, Petrova and Becker (2021), Croatia, Slovakia, Romania, and Bulgaria exhibit substantial similarity in their legal frameworks, social protection arrangements and the role and design of mandatory funded pension schemes among EU transition economies. In addition, Sweden is included in the sample as a non-eurozone EU member state, which represents a mature, developed pension system that introduced funded pension savings several decades earlier than the former European transition economies. With one of the largest pension sectors in Europe relative to GDP, Sweden offers a relevant benchmark for comparison5 . Chile is also included as a globally significant case of an extensive pension reform and a reference model for many European transition countries.
Pension funds in the selected countries are grouped into three risk-categories (A, B, and C) although they do not necessarily use those labels. For the purposes of this analysis, pension funds in the sample are classified either according to the target investment structure specified in each fund’s prospectus or according to their current exposure to different asset classes, depending on which of these sources is available. Category A funds have a medium-to-high risk profile with high equity exposure (70 to 100%). Category B funds are moderately conservative, with risk between A and C. Category C funds are the most conservative, with little or no equity exposure (below 20%). This results in a sample consisting of 23 category A funds, 26 category B funds, and 18 category C funds. Given that, according to these classification criteria, there are no risk-category C funds in Romania and Bulgaria, the data and methodology described further, for the purpose of statistical risk-adjusted performance testing, is applied only to the risk-category A and B funds in pairwise tests. 6
For each of these funds, monthly data on the unit value and the net asset value (NAV) 7 were collected for the period from July 2015 until 31 December 2024, and the corresponding time series of monthly returns and excess returns were calculated. Based on the time series of monthly excess returns, the Sharpe ratios 8 for each country’s risk-category pension funds were computed in the pairwise testing described in the following section. To enable meaningful cross-country comparisons, data on returns, i.e., excess returns are weighted by NAV, using weights based on each fund’s NAV relative to the total NAV of all funds in the same category within that country. In this way, weighted averages are obtained that reflect the share of each fund’s assets in the total assets of all funds belonging to the same category in a given country, with the notable exception in the case of Bulgaria and Sweden due to the fact that the NAV data for these two countries are only available at the annual frequency. Therefore, in the case of those two countries the monthly returns and excess returns calculation correspond to the calculations for other countries, but the weighted averages are calculated by equally weighting the monthly returns of funds in the risk-category. The risk-free rate is represented by the constantly available short-term reference rate on 3-month government securities.
3.2 Methodology
To test the differences in risk-adjusted performance, three tests designed specifically for the pairwise performance comparison of investments based on the Sharpe ratio are used. They enable the evaluation of whether the observed differences in risk-adjusted returns are statistically significant and allow for a systematic assessment of the relationship between the targeted risk profile of a fund and its realised outcomes, measured through returns and volatility. The same tests are used both to compare Sharpe ratios of the same category of pension funds across countries and between category A and category B funds within each country.
The first test employed is based on the following test statistic proposed by Jobson and Korkie ( 1981 and text ):  | (1) |
and ∅ is defined by the following equation:  | (2) |
where  is the Sharpe ratio difference 9 estimator between investments i and n, and ∅ is the variance of the asymptotic distribution of the Sharpe ratio statistic which is assumed to be normal and where µ denotes excess returns and σ standard deviation or correlation of the analysed investments and T is the sample size. Under the null hypothesis that the two Sharpe ratios are equal, a significant test value indicates a statistically meaningful difference in risk-adjusted performance between the investments, or in the case of this study – pension funds. In his paper, Memmel ( 2003) corrected the formula for ∅ which caused the formula to underestimate the asymptotic variance and simplified the formula 10, resulting in a formula for what is known as Jobson-Korkie-Memmel (JKM) test which is widely used in the finance literature for performance comparison. The JKM test formula as presented in, for instance, Auer and Schuhmacher ( 2013) is: 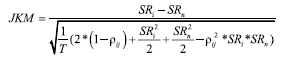 | (3) |
Due to the limitations of the JKM test, arising from the fact that the test is only valid for the normal distribution of returns and when returns do not exhibit serial correlation (as elaborated in detail in for example, Ledoit and Wolf, 2008), other tests were introduced. In this paper, therefore, the Opdyke ( 2007) test was also used which allows for non-normal return distributions and serially correlated returns. The test statistic is calculated by the standard formula referring to the Sharpe ratio difference estimator in the numerator and its standard error in the denominator: 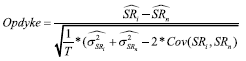 | (4) |
where the symbols defined previously retain the same meaning. On the other hand, the  estimators for the investments i and n are calculated according to a specific formula explicitly accounting for skewness and kurtosis in returns, therefore providing a generalization of earlier tests by relaxing the normality assumption which is presented and discussed in detail in Opdyke ( 2007). Finally, the Ledoit-Wolf test assesses the statistical significance of the differences between the two investments by addressing the limitations of both non-normality and serial correlation of returns, which is appropriate even in the case of smaller data samples. The test is based on the same standard formula for the test statistic as presented in equation (4). However, unlike in the previous tests, in order to provide a robust standard error, the standard error estimator is not provided analytically but is calculated by relying on the time-series block bootstrap approach as presented in Ledoit and Wolf ( 2008): 853-855 11.
4 Research findings
This section of the paper is divided into two parts. The first part performs initial analysis and reports descriptive statistics and tests related to the normality of distribution and serial correlation of the analysed data. The second part presents the main research findings related to the testing of the Sharpe ratio differences.
4.1 Initial analysis
To provide an initial overview of pension fund performance, table 1 presents returns, volatilities, and Sharpe ratios for the analysed period across the three fund categories. This descriptive comparison serves as the basis for the subsequent significance testing of Sharpe ratio differences.
Table 1Annual average return, volatility, and Sharpe ratio of pension funds for the analysed period DISPLAY Table
Based on the results in table 1, it can be seen that returns are always the highest in risk-category A and the lowest in risk-category C, while volatility is also the highest in risk-category A and the lowest in risk-category C, except in the case of Bulgarian pension funds, where volatility is higher in risk-category B than in risk-category A. Sharpe ratios are higher across the analysed countries in risk-category A compared with risk-categories B and C, and are the lowest in risk-category C with the exception of Chilean funds, where risk-category B funds achieved a higher Sharpe ratio than risk-category A funds. Also, the Sharpe ratios for all three risk-categories seem to be substantially higher in the case of Croatian pension funds relative to other countries. In risk-category A Swedish and Bulgarian funds also stand out, while Swedish and Chilean funds stand out in the risk-category B. Risk-category C, unfortunately, lacks data for the Romanian and Bulgarian funds as already mentioned in section 2.1. Moreover, as shown here, the Slovakian risk-category C funds stand out with a negative Sharpe ratio.
However, in order to draw a conclusion based on the collected dataset, the next step of the research assesses whether the differences identified in the initial analysis are statistically significant by conducting the tests presented in the section of the paper referring to the methodology (2.2). Considering the importance of the data characteristics regarding the proposed testing, the findings regarding normality and serial correlation of analysed time series are presented in tables 2 and 3. The results of the conducted Shapiro-Wilk and Jarque-Bera tests in table 2 both clearly show that only two (A and B risk-category pension funds in Sweden, denoted by SWE A and SWE B) out of the twelve-time series of excess returns in the data sample seem to be normally distributed.
Table 2Results of normality testing based on Shapiro-Wilk and Jarque-Bera tests DISPLAY Table
Regarding serial correlation, the analysed time series exhibit better performance with the first-order serial correlation being present only in the A and B risk-category pension funds in Slovakia (at 1% and 5% statistical significance levels, respectively, denoted by SVK A and SVK B) and in the case of Chilean risk-category A pension funds (at 10% statistical significance, denoted by CHI A).
Table 3Results of serial correlation testing DISPLAY Table
4.2 Sharpe ratio performance testing
The first part of the Sharpe ratio differences testing is related to the performance testing between the same risk-categories of funds across the analysed countries. The results of the pairwise testing are therefore presented in matrix form12 in tables 4 and 5 – with table 4 referring to the results of tests for risk-category A and table 5 for risk-category B.
Table 4Results of Sharpe ratio differences testing for risk-category A DISPLAY Table
The test results in table 4 show that a statistically significant difference in the Sharpe ratios in risk-category A is predominantly present in the case of Croatian pension funds (HR). In the analysed time period, the difference seems to be statistically significant relative to the Slovak (SVK), Romanian (RO) and Chilean (CHI) pension funds based on all three tests and at least at the 10% level. In the case of the relative performance of Croatian and Swedish pension funds both Opdyke and Ledoit-Wolf tests do not find the Sharpe ratio statistically significantly different at the usual significance levels, which is important due to the non-normal distribution of the data related to the Croatian pension funds. All the other pairwise tests, surprisingly, do not provide any evidence of statistically significant performance differences when measured by the Sharpe ratio in the analysed time period.
Table 5Results of Sharpe ratio differences testing for risk-category B DISPLAY Table
As shown in table 5, the test results for risk-category B funds are quite similar to those in the previous analysis, with statistically significant differences in Sharpe ratios found in all instances relative to Croatian pension funds (HR). The difference in this case is that no significant difference is detected relative to Chilean funds (CHI), but a significant difference relative to Bulgarian funds (BG) emerges across all three tests (most notably on Ledoit-Wolf at the 5% significance level).Also, even the difference relative to Swedish funds (SWE) proved to be statistically significant at the 10% level (albeit just barely with the p-value of 0.09).
In order to further explore the source of outperformance among Croatian pension funds, based solely on the available dataset of excess returns time series, the following figures 1 and 2 present the breakdown of pension funds’ performance per country and year for each analysed risk-category. As can be seen in both charts, Croatian pension funds outperform other countries in the sample on average in 2015, 2016 and 2022 13 in terms of excess return. In other years, recorded returns are better than those of most other countries, leading to lower overall volatility over the analysed period and resulting in outperformance.
Figure 1Average excess returns for risk-category A funds by country and year (in %) DISPLAY Figure Figure 2Average excess returns for risk-category B funds by country and year (in %) DISPLAY Figure
The performance presented in figures 1 and 2 can be briefly supplemented by elaborating on the evolution of the structure of investments of Croatian pension funds. When looking at the structure of assets of Croatian pension funds in table 6, it can be noted that at the end of 2015 and 2016 the structure of assets of both risk-categories of Croatian pension funds was vastly dominated by domestic investments. For risk-category A, they were around 80%, while for risk-category B they were well above the 80%. The difference between the two was in the composition, with domestic government bonds accounting for more than 70% of assets in the case of risk-category B, while holding at close to but below 50% in the case of risk-category A. The rest was primarily invested in the domestic stock market, which therefore accounted for just slightly more than 10% in risk-category B, but on the other hand made up 20-30% for risk-category A.
Table 6The structure of assets of Croatian pension funds (% of total assets, end of period) DISPLAY Table
For both risk-categories, the share of domestic investments decreased steadily in the following years dropping to slightly above 60% and 50% at the end of 2022 and 2024, respectively, for risk-category A and close to 70% and 60% for the same years for risk-category B. However, in the same period exposure to domestic stocks increased steadily in risk-category B reaching 15% at the end of 2024 while decreasing steadily to 17% at the end of the same year for risk-category A. At the same time, exposure to foreign markets in terms of foreign stock investments remained roughly stable, in the 12-14% range for risk-category A and 7-9% for risk-category B. However, both risk-categories increased exposure to foreign government bonds from 0% during the 2015-2016 period to 4% at the end of 2022 and eventually to 13% for the risk-category A and 15% for the risk-category B at the end of 2024. Furthermore, the share of foreign investments held through open investment funds rose from 8% to 14% for risk-category A and from 5% to 9% for risk-category B between the end of 2015 and the end of 2024.
Based on the provided data, the most likely factor driving the performance of Croatian pension funds is the exposure to domestic government bonds. This is supported by the fact that Croatia returned to the investment grade credit rating in 2019 which was followed by the COVID-19 pandemic in 2020. It is less clear how much direct investment in foreign government bonds and exposure to foreign markets through open investment funds contributed to performance in the post-pandemic period.
The second part of the Sharpe ratio differences testing is related to the performance testing between A and B fund risk-categories within the same country. The results of the pairwise testing for the six analysed countries are presented in table 7 below.
Table 7Results of Sharpe ratio differences testing within countries – risk-category A vs. B DISPLAY Table
The reported results show that, in the analysed period, the p-values are greater than the 0.1 threshold for all the analysed countries except for Bulgaria (BG A vs BG B), for which a statistically significant difference is detected based on the Opdyke and Ledoit-Wolf tests at the 10% and 5%, respectively. For other countries, even in the case of Slovakia (SVK), which exhibits the second largest difference in Sharpe ratios of 0.1773 (after the 0.3736 for Bulgaria), no evidence of a statistically significant difference between the performance of risk-category A vs. risk-category B funds, as measured by the Sharpe ratio, is found. Thus, the differences in the target risk profile between these two categories do not provide evidence of a statistically significant difference in risk-adjusted returns for five out of six analysed countries.
In order to provide a comprehensive analysis, table 8 reports Sharpe ratio differences for all the conducted pairwise tests, along with corresponding significance level of the difference according to the Ledoit-Wolf test. The table clearly demonstrates the role that the Sharpe ratio difference plays in the statistical significance testing. In this sense the magnitude of outperformance of the Croatian pension funds relative to other countries as the underlying factor of statistical significance of Sharpe ratio differences becomes obvious. Results in table 8 reveal that, therefore, as expected, the Sharpe ratios of Croatian pension funds of risk-category A significantly differ from those of other countries’ risk-category B funds due to, generally, an even larger difference than in the case when the same risk-categories were compared. When the same risk-categories were compared, the Sharpe ratio differences stood in the range of 0.5568 – 0.6713 and 0.4174 – 0.6929 for the risk-categories A and B, respectively. When Croatian pension fund risk-category A and other countries’ risk-category B are compared, the difference spikes above the 0.7 level with the exceptions of Sweden, for which the difference stands at 0.4845, and for Chile, 15 with a difference of 0.4565, which is not even found to be statistically significant. Lastly, it can be noted that even the Sharpe ratio differences between the Croatian pension funds’ risk-category B show large and, therefore, statistically significant differences when compared to the Slovakian and Romanian risk-category A funds. It is interesting to note that even when risk-category A is compared to risk-category B there are no recorded cases of a statistically significant difference in any of the analysed pairwise tests across countries in the sample with Sharpe ratio differences rarely reaching the magnitude of 0.3 in absolute terms.
Table 8Sharpe ratio differences and their statistical significance (based on the Ledoit-Wolf test) DISPLAY Table
5 Conclusion
The research study presented in this paper focuses on the performance of pension funds by comparing their risk-adjusted performance based on the Sharpe ratio at the country level for the A and B pension fund risk-categories. Studies in this field are not only important due to the frequent criticisms of the pension reform in the transition economies and the general concerns related to the sustainability of fully funded (nowadays primarily defined contribution) pension systems, but also in an attempt to shed light on possible differences in the pension fund management across countries and in order to attempt to steer the improvement of the industry’s regulatory framework. In this sense, the research tested Sharpe ratio differences by comparing the performance of the same risk-categories of pension funds across countries and within each country, by comparing performances between the two risk-categories. The research findings for the six analysed countries point out the statistically significant Sharpe ratio differences in the case of Croatian pension funds relative to other countries in both analysed risk-categories. The detected statistically significant outperformance in the analysed period stems from relatively high average excess returns which exhibit overall low volatility in the analysed period relative to the other countries. In the case of other countries, no statistically significant difference in performance is found, even when the risk-category A versus B funds across other countries are compared. When comparing risk-categories A and B within each country, the statistically significant difference in Sharpe ratios is found only in the case of Bulgaria highlighting the lack of evidence that would support the existence of a difference in risk-adjusted returns between the A and B risk-categories, regardless of their different risk profile target.
The findings of this study point to the surprising finding that there seems to be no major evidence of differences in risk-adjusted performance across countries, even when comparing the five EU member states in the sample with Chile or the four former transition economies in Eastern Europe in the sample with Sweden. It would, however, be worthwhile looking into the evolution of the portfolio structure of the Croatian pension funds and other analysed countries in order to better understand the sources of the detected statistically significant differences between Croatian pension funds and other countries. Such analysis would provide additional evidence that could be used to draw further conclusions about factors driving the pension funds’ performance. Additionally, it could be noted that higher returns by pension funds in Slovakia and Chile, which are accompanied by higher volatilities, as shown in the initial analysis in this study (table 1), could be explained by a greater share of foreign investments (international diversification) based on the findings by Afanador, Davis and Pedraza Morales ( 2021). However, as shown in the initial analysis, the increased returns are offset by an increase in volatility and result in similar Sharpe ratios, for which consequently no significant differences are found in testing. Therefore, no effect noted by Afanador, Davis and Pedraza Morales ( 2021) can be corroborated in this research. Furthermore, the consistent lack of statistically significant differences in performance between A and B risk-categories within countries (with the notable exception of Bulgaria) implies that future changes to the regulatory framework could move away from the current understanding of the system of risk-categories, corroborating the views in Giron et al. ( 2018) and Anarkulova, Cederburg and O’Doherty ( 2025) who advocate abandoning the “policy portfolio”. In this sense, risk-categories focusing on providing efficient diversification should strive to achieve the highest possible Sharpe ratio. While it could be argued that it is possible to achieve Sharpe ratios of similar values related to different risk-categories such that one risk-category exhibits higher volatility (and higher corresponding return) and the other exhibits lower volatility (and lower corresponding return), even low-risk efficiently diversified portfolios fail to offer protection in times of crisis because hedging (not efficient diversification) is the appropriate risk management technique to address the issue as pointed out by Martellini ( 2016). Although the empirical analysis in this research did not include the risk-category C funds due to the lack of data, their recent performance in Croatia, as discussed in the literature review, provides empirical evidence consistent with this observation.
The limitations of this research include primarily the relatively small sample related to the number of countries included, but also the monthly data available related to the period of slightly less than ten years. Future research could expand both the monthly time series and the number of countries by including more developed countries in the sample and by making the sample more geographically diverse. Furthermore, when undertaking this task, future research should take into account the limitations of relying on the Sharpe ratio for such analysis, as elaborated in Walker and Iglesias-Palau ( 2010), given that the levels of risk-free interest rates and investment opportunities differ across large datasets. Also, future research could, for this purpose, rely on panel regressions instead of pairwise tests, as in Boon et al. ( 2014) and Boon, Brière and Rigot ( 2018). The results of such future research, together with the future research focused on the analysis of portfolio structure across different countries, could provide a comprehensive overview of factors driving the performance of pension funds. This would help design a more efficient and sustainable fully-funded pension system, increasing public confidence in the overall pension system.
Notes
* The authors would like to thank two anonymous referees for their comments and suggestions.
1 As elaborated in ILO (2018) in the period from 1981 till 2014, 30 countries (14 from South America, 14 from Europe and 2 from Africa) entirely or partially privatised their public mandatory pension systems.
2 Prolonged period of low and even negative interest rates on the government bonds with the best credit rating followed by a surge in inflation.
3 Available at: https://www.hanfa.hr/statistika/financijski-pokazatelji/mirex/?from=12.02.2026.&to=16.02.2026.
4 Bulgaria has joined the Eurozone on 1 January 2026, but the data sample includes data only up to December 2024.
5 Due to the unavailability of complete data for all Swedish pension funds, the analysis relies on a representative subset managed by Alecta, one of the largest pension providers in Europe.
6 The available risk-category C data collected (at an annual frequency) was used for the purpose of initial analysis presented in table 1 at the beginning of the section of the paper presenting findings.
7 Pension funds in Bulgaria and Sweden do not publish monthly NAV data. For these countries, OECD data on NAV, published on an annual basis, are used in the analysis.
8  where Rp is the average return of the portfolio, Rf is the risk-free rate of return, and σp is the standard deviation of portfolio returns. where Rp is the average return of the portfolio, Rf is the risk-free rate of return, and σp is the standard deviation of portfolio returns.
9 In their paper, Jobson and Korkie (1981) actually refer to the transformed difference statistic, which is further explained in the original paper and is omitted here in order to be concise.
10 ρi,j in the formula denotes the correlation coefficient between the analysed investments.
11 In the same paper, Ledoit and Wolf (2008) also propose and test the Heteroskedasticity and Autocorrelation Consistent (HAC) which is similar to the Opdyke (2007) test. Due to the mentioned similarity and conclusions in the Ledoit and Wolf (2008) paper, which favour the time-series block bootstrap approach for the typical (smaller) financial sample sizes, in this paper we refer to the Ledoit and Wolf (LW) test and use the time-series block bootstrap approach for calculating the standard error.
12 Due to symmetry, only half of the results in the table are reported.
13 In 2022 the highest excess return is actually related to the lowest loss.
14 Data available for download at: https://www.hanfa.hr/statistika/mirovinski-fondovi/.
15 As can be noted in table 1, the Sharpe ratio of risk-category B in Chile is higher than that of risk-category A. This anomaly causes the difference in Sharpe ratios between Croatian and Chilean pension funds of risk category A to be statistically significant, while proving insignificant when risk-categories A and B of the same countries are compared.
* The authors would like to thank two anonymous referees for their comments and suggestions.
1 As elaborated in ILO ( 2018) in the period from 1981 till 2014, 30 countries (14 from South America, 14 from Europe and 2 from Africa) entirely or partially privatised their public mandatory pension systems.
2 Prolonged period of low and even negative interest rates on the government bonds with the best credit rating followed by a surge in inflation.
4 Bulgaria has joined the Eurozone on 1 January 2026, but the data sample includes data only up to December 2024.
5 Due to the unavailability of complete data for all Swedish pension funds, the analysis relies on a representative subset managed by Alecta, one of the largest pension providers in Europe.
6 The available risk-category C data collected (at an annual frequency) was used for the purpose of initial analysis presented in table 1 at the beginning of the section of the paper presenting findings.
7 Pension funds in Bulgaria and Sweden do not publish monthly NAV data. For these countries, OECD data on NAV, published on an annual basis, are used in the analysis.
8 where Rp is the average return of the portfolio, Rf is the risk-free rate of return, and σp is the standard deviation of portfolio returns.
9 In their paper, Jobson and Korkie ( 1981) actually refer to the transformed difference statistic, which is further explained in the original paper and is omitted here in order to be concise.
10 ρi,j in the formula denotes the correlation coefficient between the analysed investments.
11 In the same paper, Ledoit and Wolf ( 2008) also propose and test the Heteroskedasticity and Autocorrelation Consistent (HAC) which is similar to the Opdyke ( 2007) test. Due to the mentioned similarity and conclusions in the Ledoit and Wolf ( 2008) paper, which favour the time-series block bootstrap approach for the typical (smaller) financial sample sizes, in this paper we refer to the Ledoit and Wolf (LW) test and use the time-series block bootstrap approach for calculating the standard error.
12 Due to symmetry, only half of the results in the table are reported.
13 In 2022 the highest excess return is actually related to the lowest loss.
15 As can be noted in table 1, the Sharpe ratio of risk-category B in Chile is higher than that of risk-category A. This anomaly causes the difference in Sharpe ratios between Croatian and Chilean pension funds of risk category A to be statistically significant, while proving insignificant when risk-categories A and B of the same countries are compared.
Disclosure statement
The authors have no conflicts of interest to declare.
AI declaration
No generative AI or AI‑assisted tools were used in the preparation of this manuscript.
References
Afanador, J. P., Davis, R. M. and Pedraza Morales, A. E., 2021. Estimating the Gains from International Diversification: The Case of Pension Funds. Policy Research Working Paper Series, No. 9635 [ CrossRef]
Amenc, N. and Goltz, F., 2013. Smart Beta 2.0. The Journal of Index Investing, 4(3), pp. 15-23 [ CrossRef]
Amenc, N. [et al.], 2014. Towards Smart Equity Factor Indices: Harvesting Risk Premia Without Taking Unrewarded Risks. The Journal of Portfolio Management, 40(4), pp. 106-122 [ CrossRef]
Anarkulova, A., Cederburg, S. and O'Doherty, M. S., 2025. Beyond The Status Quo: A Critical Assessment of Lifecycle Investment Advice [ CrossRef]
Andonov, A., Bauer, R. and Cremers, M., 2012. Can Large Pension Funds Beat the Market? Asset Allocation, Market Timing, Security Selection and the Limits of Liquidity [ CrossRef]
Antolin, P., 2008. Pension Fund Performance. OECD Working Papers on Insurance and Private Pensions, No. 20 [ CrossRef]
Auer, B. R. and Schuhmacher, F., 2013. Performance Hypothesis Testing With the Sharpe Ratio: The Case of Hedge Funds. Finance Research Letters, 10(4), pp. 196-208 [ CrossRef]
Blake, D., Lehmann, B. N. and Timmermann, A., 1999. Asset Allocation Dynamics and Pension Fund Performance. The Journal of Business, 72(4), pp. 429-461. https://www.jstor.org/stable/10.1086/209623
Bohl, M. T., Lischewski, J. and Voronkova, S., 2011. Pension Funds' Performance in Strongly Regulated Industries in Central Europe: Evidence from Poland and Hungary. Emerging Markets Finance and Trade, 47(3), pp. 80-94 [ CrossRef]
Boon, L.-N. [et al.], 2014. Pension Regulation and Investment Performance: Rule-Based Vs. Risk-Based [ CrossRef]
Boon, L. N., Brière, M. and Rigot, S., 2018. Regulation and Pension Fund Risk-Taking. Journal of International Money and Finance, 84, pp. 23-41 [ CrossRef]
Brinson, G. P., Singer, B. D. and Beebower, G. L., 1991. Determinants of Portfolio Performance II: An Update. Financial Analysts Journal, 47(3), pp. 40-48 [ CrossRef]
Broeders, D. and De Haan, L., 2020. Benchmark Selection and Performance. Journal of Pension Economics and Finance, 19(4), pp. 511-531 [ CrossRef]
Cesarone, F., Scozzari, A. and Tardella, F., 2020. An Optimization-Diversification Approach to Portfolio Selection. Journal of Global Optimization, 76, pp. 245-265 [ CrossRef]
De la Torre Torres, O. V. [et al.], 2015. A Minimum Variance Benchmark to Measure the Performance of Pension Funds in Mexico. Contaduría y Administración, 60(3), pp. 593-614 [ CrossRef]
Dyck, A., Manoel, P. and Morse, A., 2022. Outraged by Compensation: Implications for Public Pension Performance. The Review of Financial Studies, 35(6), pp. 2928-2980 [ CrossRef]
Eling, M. and Faust, R., 2010. The Performance of Hedge Funds and Mutual Funds in Emerging Markets. Journal of Banking & Finance, 34(8), pp. 1993-2009 [ CrossRef]
Foo, J. and Witkowska, D., 2016. Investment Performance of US and European Pension Funds. A Comparative Analysis. The IEB International Journal of Finance, 13, pp. 99-109 [ CrossRef]
Jobson, J. D. and Korkie, B., 1985. Some tests of linear asset pricing with multivariate normality. Canadian Journal Of Administrative Sciences / Revue Canadienne Des Sciences De L'administration, 2(1), pp. 114-138 [ CrossRef]
Jobson, J. D. and Korkie, B., 1981. Performance Hypothesis Testing with the Sharpe and Treynor Measures. The Journal of Finance, 36(4). pp. 889-908 [ CrossRef]
Kobor, A. and Muralidhar, A., 2018. How a New Bond Can Greatly Improve Retirement Security [ CrossRef]
Kompa, K. and Witkowska, D., 2015. Pension System in Poland: Performance of Pension Funds. Estudios De Economía Aplicada, 33(3), pp. 965-984 [ CrossRef]
Kupčík, P. and Gottwald, P., 2017. The Return-Risk Performance of Selected Pension Fund in OECD With Focus on the Czech Pension System. Acta Universitatis Agriculturae Et Silviculturae Mendelianae Brunensis, 64(6), pp. 1981-1988 [ CrossRef]
Ledoit, O. and Wolf, M., 2008. Robust performance hypothesis testing with the Sharpe ratio. Journal of Empirical Finance, 15, pp. 850-859 [ CrossRef]
Martellini, L., 2016. Mass customization versus mass production – how an industrial revolution is about to take place in money management and why it involves a shift from investment products to investment solutions. Journal of Investment Management, 14(3), pp. 5-13.
Martellini, L. and Milhau, V., 2018. Proverbial Baskets Are Uncorrelated Risk Factors! A Factor-Based Framework For Measuring And Managing Diversification In Multi-Asset Investment Solutions. Journal of Portfolio Management, Suppl. Multi-Asset Special Issue, 44(2), pp. 8-22 [ CrossRef]
Martellini, L., Milhau, V. and Mulvey, J., 2019. "Flexicure" retirement solutions: A part of the answer to the pension crisis? Journal of Portfolio Management, 45(5), pp. 136-151 [ CrossRef]
Memmel, C., 2003. Performance hypothesis testing with the Sharpe ratio. Finance Letters, (1), pp. 21-23.
Mittelstaedt, H. F. and Olsen, J. C., 2003. An empirical analysis of the investment performance of the Chilean pension system. Journal of Pension Economics and Finance, 2(1), pp. 7-24 [ CrossRef]
OECD, 2023. Pensions at a Glance 2023. Paris: OECD [ CrossRef]
Opdyke, J. D., 2007. Comparing Sharpe ratios: So where are the p-values? Journal of Asset Management, 8, pp. 308-336 [ CrossRef]
Schneider, S., Petrova, T. and Becker, U., 2021. Pension Maps: Visualising the Institutional Structure of Old Age Security in Europe. Munich: Mpisoc [ CrossRef]
Walker, E. and Iglesias-Palau, A., 2010. Financial Performance of Pension Funds: An Exploratory Study [ CrossRef]
Afanador, J. P., Davis, R. M. and Pedraza Morales, A. E., 2021. Estimating the Gains from International Diversification: The Case of Pension Funds. Policy Research Working Paper Series, No. 9635 [ CrossRef]
Amenc, N. and Goltz, F., 2013. Smart Beta 2.0. The Journal of Index Investing, 4(3), pp. 15-23 [ CrossRef]
Amenc, N. [et al.], 2014. Towards Smart Equity Factor Indices: Harvesting Risk Premia Without Taking Unrewarded Risks. The Journal of Portfolio Management, 40(4), pp. 106-122 [ CrossRef]
Anarkulova, A., Cederburg, S. and O'Doherty, M. S., 2025. Beyond The Status Quo: A Critical Assessment of Lifecycle Investment Advice [ CrossRef]
Andonov, A., Bauer, R. and Cremers, M., 2012. Can Large Pension Funds Beat the Market? Asset Allocation, Market Timing, Security Selection and the Limits of Liquidity [ CrossRef]
Antolin, P., 2008. Pension Fund Performance. OECD Working Papers on Insurance and Private Pensions, No. 20 [ CrossRef]
Auer, B. R. and Schuhmacher, F., 2013. Performance Hypothesis Testing With the Sharpe Ratio: The Case of Hedge Funds. Finance Research Letters, 10(4), pp. 196-208 [ CrossRef]
Blake, D., Lehmann, B. N. and Timmermann, A., 1999. Asset Allocation Dynamics and Pension Fund Performance. The Journal of Business, 72(4), pp. 429-461. https://www.jstor.org/stable/10.1086/209623
Bohl, M. T., Lischewski, J. and Voronkova, S., 2011. Pension Funds' Performance in Strongly Regulated Industries in Central Europe: Evidence from Poland and Hungary. Emerging Markets Finance and Trade, 47(3), pp. 80-94 [ CrossRef]
Boon, L.-N. [et al.], 2014. Pension Regulation and Investment Performance: Rule-Based Vs. Risk-Based [ CrossRef]
Boon, L. N., Brière, M. and Rigot, S., 2018. Regulation and Pension Fund Risk-Taking. Journal of International Money and Finance, 84, pp. 23-41 [ CrossRef]
Brinson, G. P., Singer, B. D. and Beebower, G. L., 1991. Determinants of Portfolio Performance II: An Update. Financial Analysts Journal, 47(3), pp. 40-48 [ CrossRef]
Broeders, D. and De Haan, L., 2020. Benchmark Selection and Performance. Journal of Pension Economics and Finance, 19(4), pp. 511-531 [ CrossRef]
Cesarone, F., Scozzari, A. and Tardella, F., 2020. An Optimization-Diversification Approach to Portfolio Selection. Journal of Global Optimization, 76, pp. 245-265 [ CrossRef]
De la Torre Torres, O. V. [et al.], 2015. A Minimum Variance Benchmark to Measure the Performance of Pension Funds in Mexico. Contaduría y Administración, 60(3), pp. 593-614 [ CrossRef]
Dyck, A., Manoel, P. and Morse, A., 2022. Outraged by Compensation: Implications for Public Pension Performance. The Review of Financial Studies, 35(6), pp. 2928-2980 [ CrossRef]
Eling, M. and Faust, R., 2010. The Performance of Hedge Funds and Mutual Funds in Emerging Markets. Journal of Banking & Finance, 34(8), pp. 1993-2009 [ CrossRef]
Foo, J. and Witkowska, D., 2016. Investment Performance of US and European Pension Funds. A Comparative Analysis. The IEB International Journal of Finance, 13, pp. 99-109 [ CrossRef]
Jobson, J. D. and Korkie, B., 1985. Some tests of linear asset pricing with multivariate normality. Canadian Journal Of Administrative Sciences / Revue Canadienne Des Sciences De L'administration, 2(1), pp. 114-138 [ CrossRef]
Jobson, J. D. and Korkie, B., 1981. Performance Hypothesis Testing with the Sharpe and Treynor Measures. The Journal of Finance, 36(4). pp. 889-908 [ CrossRef]
Kobor, A. and Muralidhar, A., 2018. How a New Bond Can Greatly Improve Retirement Security [ CrossRef]
Kompa, K. and Witkowska, D., 2015. Pension System in Poland: Performance of Pension Funds. Estudios De Economía Aplicada, 33(3), pp. 965-984 [ CrossRef]
Kupčík, P. and Gottwald, P., 2017. The Return-Risk Performance of Selected Pension Fund in OECD With Focus on the Czech Pension System. Acta Universitatis Agriculturae Et Silviculturae Mendelianae Brunensis, 64(6), pp. 1981-1988 [ CrossRef]
Ledoit, O. and Wolf, M., 2008. Robust performance hypothesis testing with the Sharpe ratio. Journal of Empirical Finance, 15, pp. 850-859 [ CrossRef]
Martellini, L., 2016. Mass customization versus mass production – how an industrial revolution is about to take place in money management and why it involves a shift from investment products to investment solutions. Journal of Investment Management, 14(3), pp. 5-13.
Martellini, L. and Milhau, V., 2018. Proverbial Baskets Are Uncorrelated Risk Factors! A Factor-Based Framework For Measuring And Managing Diversification In Multi-Asset Investment Solutions. Journal of Portfolio Management, Suppl. Multi-Asset Special Issue, 44(2), pp. 8-22 [ CrossRef]
Martellini, L., Milhau, V. and Mulvey, J., 2019. "Flexicure" retirement solutions: A part of the answer to the pension crisis? Journal of Portfolio Management, 45(5), pp. 136-151 [ CrossRef]
Memmel, C., 2003. Performance hypothesis testing with the Sharpe ratio. Finance Letters, (1), pp. 21-23.
Mittelstaedt, H. F. and Olsen, J. C., 2003. An empirical analysis of the investment performance of the Chilean pension system. Journal of Pension Economics and Finance, 2(1), pp. 7-24 [ CrossRef]
OECD, 2023. Pensions at a Glance 2023. Paris: OECD [ CrossRef]
Opdyke, J. D., 2007. Comparing Sharpe ratios: So where are the p-values? Journal of Asset Management, 8, pp. 308-336 [ CrossRef]
Schneider, S., Petrova, T. and Becker, U., 2021. Pension Maps: Visualising the Institutional Structure of Old Age Security in Europe. Munich: Mpisoc [ CrossRef]
Walker, E. and Iglesias-Palau, A., 2010. Financial Performance of Pension Funds: An Exploratory Study [ CrossRef]
|