|
|
|
Abstract
Economists agree that physical and intangible capital can have a positive impact
on productivity growth. However, the dependence of intangible capital on adequate
institutions may lead to its weak impact on productivity in countries with
weak institutions. The aim of this paper is to assess the link between investments
in physical and intangible capital on the one hand and productivity on the other.
For determining differences in the level of effect of physical and intangible capital
on productivity depending on institutional and developmental characteristics of
countries, the research is divided into two parts. First, we assessed regression
models for Croatia, after which we used panel analysis to evaluate a number of
models for highly developed countries with quality institutions. The results suggest
a significant positive effect of physical and intangible capital in advanced
economies, while in Croatia only physical capital has a significant impact.
Keywords: labour productivity; intangible capital; panel analysis; institutions; economic development
JEL: O31, O34, O43, O47
1 Introduction
Determinants of labour productivity are important because they greatly influence economic competitiveness and growth of living standards (real wages) of individuals. Increase in labour productivity should necessarily lead to more output being produced in one hour of work with a more efficient use of production factors, resulting from workers being more equipped with physical and intangible (intellectual) capital per hour of work. Also, the increase in labour productivity is reflected in the growth of the overall technology level and other productivity factors, influenced by the quality and quantity of highly skilled workforce, as well as formal (public sector, laws, regulations, penalties) and informal (customs, norms) institutions, whereby well-designed economic policies can stimulate these factors.
Physical capital (machines, devices) and its role in productivity growth are well defined in the literature, but the accelerated development of intangible capital requires more detailed analyses of it and its role. One of the first references to intangible capital has been made by Griliches (  1981 1981), implying total stocks of intangible value (or know-how) in the economy (R&D investments, patents, organisational and human capital). Researchers also provided more detailed explanations of the positive effect of intangible capital on labour productivity on both microeconomic (e.g. Brynjolfsson, Hitt and Yang, 2002) and macroeconomic level (Solow, 1987; Nakamura, 2010).
Although the effect of intangible capital on labour productivity has already been investigated in more detail both in theory and empirically, the link with institutional and development characteristics has been studied only partially. In theory, a good institutional environment is necessary for intangible capital to have an effective impact on productivity (Acemoglu, Aghion and Zilibotti, 2006; Aghion and Howitt, 2006). But what is needed even more are quality and stimulating economic policies, developed financial markets and laws on the protection of property rights and efficient public administration. The most developed countries will base productivity growth on original innovation and the use of innovative intangible capital. In other words, they are at the technological frontier, i.e. their good institutional conditions lead to an increase in the efficiency of such capital (Acemoglu, Aghion and Zilibotti, 2006;).
High levels of human capital can also lead to more efficient use of intangible capital in the economy. Clearly, there is a significant link between productivity and intangible capital in countries with well-defined institutional and development characteristics and an environment stimulating investments.
The impact of intangible capital characteristics on productivity can be analysed by comparing countries with different institutional and development characteristics, which is the objective of this paper. In the first part, we conduct a regression analysis of aggregate data and examine the impact of physical and intangible capital on labour productivity in Croatia. According to WIPO data ( 2025), Croatia is classified as a country with a relatively inadequate institutional framework for stimulating intangible investments, and the stagnant productivity dynamics in recent years serve as a good example of a country in which the impact of intangible capital may not be significant due to inadequate institutional support in the transition period toward higher development levels.
The second part is a panel analysis of sectoral and aggregate data of highly developed countries with quality institutional characteristics. The objective is to identify differences between the two parts of the analysis, in particular the importance of the long-term effects of intangible capital on labour productivity. By doing so, we could determine potential differences in the impact of institutional and development characteristics on the effect of intangible capital on productivity. This paper, modelled on Griliches ( 1995), uses regression analysis for estimating and calculating long-term coefficients of effect of (in-)tangible capital on productivity. Indeed, due to a possible time lag in the impact of capital on productivity, any analysis of standard estimated coefficients might not provide adequate conclusions. In the second part of the analysis, we also use an estimator which takes into account certain properties in the panel data that may potentially impair the impartiality of model results (primarily cross-sectional dependence). In the second part of the analysis, we also employ an estimator that accounts for certain properties of panel data that may potentially compromise the unbiasedness of the model results (primarily cross-sectional dependence). In this context, we estimate individualized average (as well as pooled) effects that are isolated from spillover effects arising from the statistical mechanism of cross-sectional dependence.
This research offers a more flexible design (comparative analysis of country with weaker institutional features and those with superior institutions) that can better interpret the causes of links between different types of capital and productivity. The review of empirical research provided below did not find a satisfactory number of studies dealing with the impact of physical and, more importantly, intangible capital on labour productivity in various institutional circumstances. Moreover, there have been no empirical surveys of determinants of labour productivity in relation to intangible capital for Croatian case. Furthermore, a partial novelty is the use of models that estimate the long-term effects of links between selected variables (as well as the consideration of certain statistical issues in the part of the analysis with panel data related to cross-sectional dependence), but in a different context than in other earlier studies of productivity determinants using similar estimators.
The results of this research primarily imply a significant impact of both physical and intangible capital on labour productivity in countries with developed institutions. On the other hand, a significant effect of intangible capital did not emerge in the analysis for Croatia. The result points to the importance of institutions that would support the creation of a foundation for the accumulation of intangible capital which, due to its complexity of application, is highly sensitive to institutional support in the country. Support is essential through well-designed laws, reducing political and economic costs that will allow already established but lagging market players to exit the market and facilitate the entry of fast-growing companies into the market. It also facilitates the financing of such companies, for example through subsidies, the development of financial markets and the creation of adequate human capital.
The following chapter provides the most important findings of previous empirical research on the impact of intangible capital on labour productivity; third chapter provides an overview and description of the data, their sources and the econometric methods used; fourth chapter presents the results of empirical research and the fifth chapter provides discussion of results and conclusions.
2 Literature overview
Theoretical research accumulated to this day mainly dealt with intangible capital analyses in the context of endogenous emergence of technological advances affecting productivity growth (Romer, 1990; Grossman and Helpman, 1991; Aghion and Howitt, 1992; Benhabib and Spiegel, 1994; Griliches and Mairesse, 1998).
Recent decades have seen weaker labour productivity growth dynamics, especially in the most developed countries, which some researchers attribute to lower growth rates of intangible capital investment (Van Ark, 2016; Van Ark and O’Mahony, 2016). However, the effect of intangible capital on productivity remains relatively significant in the empirical sense, not only in the theoretical sense, as suggested by the above authors.
Among the empirical research so far, interesting findings are offered by Corrado, Haskel and Jona-Lasinio ( 2017), analysing the impact of intangible capital investments on productivity growth in ten EU member states in the period 1998-2007. They find that productivity is higher in sectors with greater use of ICT technology and investments in intangible capital and knowledge.
Furthermore, in the extensive empirical literature providing evidence of a statistically significant positive link between intangible (and certainly physical) capital and the level of production per worker, surveys by Bontempi and Mairesse ( 2015) for Italy, Roth and Thum ( 2013), Roth ( 2020), Hintzmann, Lladós-Masllorens and Ramos ( 2021) for EU countries, Corrado, Hulten and Sichel ( 2009) for the USA in the period 1973-2003 stand out. Similar results are also reported in Baldwin et al. ( 2009) for Canada, and Fukao et al. ( 2009) for Japan. The latter research is particularly interesting because they find a significant positive link for the period 1985- 2005, although investments in intangible capital in Japan in the late 1980s and early 2000s recorded slower growth, which can explain the difference in labour productivity growth between Japan and the USA. Slow investment in intangible capital in Japan can also be linked to general formal, and even more so, informal Japanese institutions that are more generally rigid in a socio-cultural sense (slow to accept new values and prone to traditional values) and do not allow for subtle adaptation to innovations resulting from intangible capital investments(Rosser and Rosser, 2018).
The differences in dynamics have also been dealt with by Hao, Manole and Van Ark ( 2009) for France, Germany, Italy, Spain, USA and the UK, implying that countries with relatively higher intangible capital investments have better productivity indicators. Again, differences between countries can be explained by differences in their public policies and institutions that do not channel the private sector enough toward innovation and primary research.
Furthermore, a positive link is also found in sector analyses, as Eberhardt, Helmers and Strauss ( 2013) show for 13 industries in 10 highly developed countries; Crass, Licht and Peters ( 2015) for sectors in Germany, where the effect of physical capital on productivity increases parallel to an increase in intangible capital investment.
While, on the one hand, the literature points to the importance of physical, and especially intangible capital, on the other hand there is a lack of research into institutional and developmental determinants of the relationship between physical and intangible capital and labour productivity.
The only piece of research we found that goes into more detail regarding the institutional and development determinants of the link between intangible capital and labour productivity is the one by Castelli et al. ( 2024). They introduce certain heterogeneities and assess the impact of intangible capital on productivity in western and eastern European countries, identifying complementarity of the institutional environment as the missing link for explaining differences. For the period 2000-2017, they deepen their analysis further by adding interactive members to the panel model equations for eastern EU countries, assessing the differences between EU core countries (with good institutional conditions) and peripheral countries (i.e. eastern), with a weaker development environment. The results suggest a positive and significant link between labour productivity and intangible capital, for all EU countries. On the other hand, coefficients expanded with interaction members of eastern EU countries with intangible capital do not show a significant positive link with productivity, suggesting that lack of capacity and an adequate institutional environment is the main reason for the weak impact of intangible capital on productivity, resulting in a more pronounced productivity gap between the eastern and western EU countries.
Moreover, Roth ( 2019) argues that the literature on the determinants of intangible capital investment decisions, as well as on the efficiency of the impact of physical and intangible capital on productivity, depends strictly on the quality of public infrastructure that helps such investment to be used more efficiently. Public investment in intangible capital then encourages companies to invest in such capital themselves, thereby ensuring productivity growth.
3 Data and methodology
The paper uses data from the EU KLEMS database (EU level analysis of capital (K), labour (L), energy (E), materials (M) and service (S) inputs) (Bontadini et al., 2023).
For the purpose of econometric analysis, we collected sectoral and aggregate data on net cumulative investments (stocks) of total physical capital ( Total tangible capital stock – K), which serve as a control variable. For the main independent variable, we collected data on net cumulative investments in intangible capital ( Total intangible capital stock – IN), such as computer operating systems and databases, research and development, organisational and human capital (Bontadini et al., 2023).
K and IN were calculated using the geometric PIM method ( Perpetual Inventory Method), while details on K and IN calculation (with depreciation rate included) are explained in detail in Bontadini et al. ( 2023). For the calculation of the effect of capital equipment per hours of work, K and IN are then divided by the total annual hours of work.
Net cumulative investments (stocks) were selected for analysis, rather than current or GFCF ( Gross Fixed Capital Formation). Namely, stocks are better observed over time, i.e. the impact of K or IN on productivity depends on the composition of investments in present and past periods, and capital, such as the intangible one, needs a certain period in order to be efficiently applied in companies, sectors or the whole economy. GFCF is not so suitable for observation over time; even when included in regression specifications as lagged coefficient, it will not well represent the effect of time flow as it ignores the impact of time depreciation of capital (Eberhardt, Helmers and Strauss, 2013). Cumulative capital and accumulated knowledge from the beginning of the period means little if it does not continue to increase, i.e. depreciation must be introduced in the calculation (e.g. the use of new working methods and new knowledge from twenty years ago will not mean much for current productivity if new knowledge is not introduced over time).
For the calculation of dependent variable – labour productivity – we first collected Gross value added (GVA) data. After that, GVA was divided by data on total annual hours of work of employees in a specific sector or country in order to obtain a comparable measure of Labour productivity (LP). There are several reasons for selecting GVA per hour of work. While GVA per employee is also used often, such indicator may be more difficult to compare internationally due to differences in working hours of employees over certain periods in different countries and sectors. Labour productivity levels measured by GVA per hour of work in two countries in comparison could be the same, while GVA per number of employees could be higher in the country where employees work more hours per year, and one employee can produce more annually, leading to apparently higher labour productivity. Also, the use of GVA, unlike GDP, avoids the unintended effect of taxes.
In order to reflect the real values, all data are reported in constant prices (chained linked volumes), with price deflators adjusted for each item of national accounts (i.e. different deflator for GVA, physical and intangible capital).
All data – both sectoral and aggregated – refer to the period 1995-2021. Aggregated data includes all economic sectors according to the usual NACE Rev. 2 classification, while sectoral data includes 15 service and manufacturing industries (shown in table 1, coded by ordinal number). While for 13 highly developed economies (Austria, Czechia, Denmark, Finland, France, Italy, Japan, the Netherlands, Germany, the United States, Spain, Sweden and the United Kingdom) both sectoral and aggregated data were available, for Croatia only aggregated data is obtainable.
Thus, the first part analyses observations of aggregate data for Croatia. In the second part, a panel analysis was carried out for 13 countries – first of aggregate data for 12 countries (UK missing), over 27 years, i.e. 324 observations. Sectoral data were then analysed, for the country-sector (180 units), over 27 years, totalling 4,860 observations.
Table 1Description of sectors used in the analysis DISPLAY Table
All variables have been log transformed to better adapt to the linear assumptions of the regression models used.
For this type of analysis, we optioned to use some of the methods that calculate the long-term effects of certain variables on the variable of interest. In this sense, model should also provide the use of time shifts of all variables, bearing in mind the bias of empirical tests of a static nature that do not take into account statistically significant dynamic and time-persisting relationships between variables.
The formal explanation of the link between labour productivity and physical and intellectual capital can be explained by a neoclassical production function. Most commonly used is the Cobb-Douglas production function, which, for example, Roth and Thum (2013) represent as:
where Y is the production level represented by GVA, A is a constant, defined as the technology or total factor productivity that is neutral in Hicks’sense, i.e. does not alter the distribution of labour and capital in production but increases their productivity. K are stocks of a sector’s physical capital, L are the total hours of work of employees, IN are stocks of intangible capital used in the production of the sector and ε is the stochastic error component. Assuming linear homogeneity of the production function (sum of the elasticity coefficients α, β and η equals 1), equation (1) can be corrected with the total hours of labour: 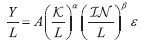 | (2) |
with L1-α-β / L = L1-α-β-1 = L -α-β = 1 / Lα+β and η = 1- α- β. By log transforming expression (2), it can be expressed as: 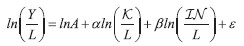 | (3) |
where  has already been defined by LP,  is K, while  is IN. Equation (3) provides a good starting point for regression analysis of data for Croatia and panel data for 13 highly developed countries.
The following is an explanation of the model estimation for Croatia. For an adequate estimation of long-term impact of IN on LP, we use an autoregression model with distributed lags ( AutoRegressive Distributed Lag – ARDL).With the help of the ARDL model, the dynamic specification provides long-term coefficients that best determine the effect of IN and K on LP. Due to the small sample for Croatia, this model is also useful because it allows different shifts of (non-)dependent variables, which leads to savings in degrees of freedom. Defining t as a time unit, such a dynamic model can, as demonstrated by Kripfganz and Schneider ( 2023), be represented as: 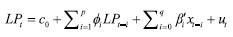 | (4) |
where c0 is a constant,  represents auto-regression structure of LP with p shifts, while  shows the structure of the time distribution of effects of independent variables with q shifts, whereby βi comprises coefficients of effect of K and IN on LP to be estimated, while xt = ( Kt, INt) ' is the independent variables vector comprising K and IN. The specification in (4) makes it possible to estimate the long-term effects of K and IN on LP, just as Griliches( 1995)suggested in the analysis of the impact of capital investments on productivity. Such long-term coefficients can be obtained by redefining the ARDL model in (4), and the model can be represented as:  | (5) |
where α is the coefficient with the error-correction member ( EC), while θ comprises long-term coefficients for K and IN. α and θ can be defined as: 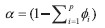 | (6) |
 | (7) |
For the ARDL analysis, the Pesaran, Shin and Smith ( 2001) boundary test (PSS Bounds test) is also important, indicating the existence of a genuine long-term connection and not one driven by similar common trends through a process of spurious regression. The null hypothesis of the test assumes that there is no long-term relationship between variables, and the test itself contains two steps. The first step measures the aggregate statistical significance of all coefficients of independent variables via the group F-test, i.e. the significance of long-term coefficients, and the second step measures the statistical significance of the error correction member parameter α. At the same time, the t-test for α is not valid in the estimated model as t statistics for α does not have a standard distribution at null hypothesis, and the second step of the boundary test uses adjusted critical values according to Kripfganz and Schneider ( 2020) and approximated p-values for the t-test. We now continue with the description of panel model estimations for thirteen highly developed countries. Since the focus of the paper is on long-term impact assessment, some of the methods of cointegration analysis can be used, adapted to the panel data with a longer time component, which is potentially non-stationary. Ditzen ( 2021) states that the model for assessing impact of IN and K on LP should take into account the potentially significant dynamic structure of variables, i.e. it should be able to shift all variables. Also, if not removed from the specification, there may be cross-sectional dependence in model residuals, which may lead to biased estimates. Therefore, an econometric analysis of the panel data was selected, which takes all these problems into account. The panel ARDL model, identical to the one from the first part of the analysis, but adapted to the panel data, is initially expressed, as per Chudik et al. ( 2013), as: 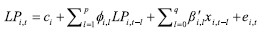 | (8) |
whereby: 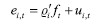 | (9) |
 | (10) |
i = 1, ..., N and t = 1, ..., T are cross-sectional and time units. In addition, ƒ t is a m × 1 vector of unobserved common factors ( m is the number of time shifts of these factors), ϱi is a vector of so-called heterogeneous factor loading associated with LP, i.e. Γi is a matrix of heterogeneous factor loading associated with independent variables ( k is the number of independent variables). ci represents fixed effects specific to cross-sectional units. Idiosyncratic components vit of xit are under assumption distributed independently of ui,t. LPi,t and vector xi,t are identical to the first part of the analysis, only in the notation for the panel data. Unlike the first part of the analysis, the model in (4) cannot be redefined directly to obtain long-term coefficients, as the estimation of the equation by using the standard least squares method will lead to a biased statistical estimation. This bias is created by the structure of common factors defined by (9) and (10) (which is why cross-sectional dependence appears in the panel data), i.e. the bias problem arises due to the omission of an important independent variable (in this case ƒ t) (Chudik et al., 2013; Ditzen, 2021). Chudik and Pesaran ( 2015) therefore propose a method that can estimate equation (4) consistently, approximating common factors by adding cross-sectional averages as additional members to this equation. It can be shown that with the crosssectional component increasing, the addition of cross-sectional averages and its shifts to the dynamic model, it encompasses ƒ t and OLS ( Ordinary Least Squares) estimation becomes impartial (Chudik and Pesaran ( 2015) offer mathematical evidence). According to their framework rule, at least  of the shifts of such averages should be added, where T is the time component for the available panel data. An additional problem with the dynamic specification (4) is the shift of the dependent variable leading to endogeneity due to the correlation of shifts with previous realizations of the relation error, leading to inconsistencies of the OLS estimator. However, Chudik and Pesaran ( 2015) explain that a specification with additional members of cross-sectional averages also addresses the issue of endogeneity and becomes impartial if a sufficient number of shifts of such averages are associated. In such cases, equation (4) can be formulated as:  | (11) |
The vector 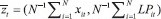 contains cross-sectional averages of 225 all variables connected to the model, where coefficients with cross-sectional averages within the vector γi,l are usually omitted in the model results because they do not have a clear interpretation. Therefore, equation (11) becomes well specified to obtain long-term coefficients from such specification by applying the OLS method. A model can then be written for the second part of the analysis as demonstrated by Chudik et al. ( 2013):  | (12) |
where long-term coefficients are contained inside  , while coefficient with EC member is defined as  . For now, θi are shown heterogeneously by i; however, an explanation is in order. To obtain more information on how variables are connected, equation (12) is estimated in two ways for both data levels. The first concerns the estimation of model (12) with the assumption of homogeneity of long-term coefficients, i.e. θ. In such cases, equation (12) is estimated through the DCCE-PMG (Dynamic Common Correlated Effects – Pooled Mean Group) estimator, which calculates one pooled long-term coefficient for K and IN based on panel data, while short-term coefficients for K and IN are individually estimated by cross-sectional units, and their significance is measured on the average of these short-term coefficients per unit. The other method refers to the estimation of equation (12) with the DCCE-MG ( Dynamic Common Correlated Effects – Mean Group) estimator, which evaluates the individual equations for each cross-sectional unit, taking the average for each coefficient per unit and measuring the correlation of variables with this average coefficient value. This ensures the heterogeneity of model coefficients, i.e. the possible significant heterogeneity between cross-sectional units is controlled. The significance of effect of K and IN on LP is measured by average long-term coefficients  We should also explain how the level of cross-sectional dependence is determined in panel data. The estimation of cross-sectional dependence is tested using the Pesaran CD ( Cross-sectional Dependence) test, whose results are important because they show how well the influence of cross-sectional dependence has been removed in the model by the addition of cross-sectional averages. Test may also be important before the model estimation, as an indicator of the need to include cross-sectional averages in the model. The null hypothesis of the Pesaran test isthat the errors of the relation ei,t of the test equation without cross-sectional averages are weakly cross-sectionally dependent, while the alternative hypothesis assumes strong dependence. Pesaran ( 2004) proposes the following test statistics: 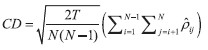 | (13) |
where the estimated correlation coefficient is: 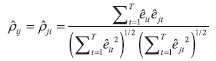 | (14) |
Chudik, Pesaran and Tosetti ( 2011) define the first type of weak cross-sectional dependence of errors as follows: 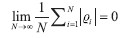 | (15) |
Another, stronger version at a specific constant K, independent of N, where for any large enough N, is defined as: 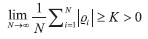 | (16) |
Cross-sectional independence is here defined as θ ϱi = 0∀ i. Other factors are formulated in a similar manner. Since cross-sectional independence is in itself an excessively restrictive assumption, only a strong dependence defined with an asymptotic definition in (16) is problematic (Pesaran, 2015). In such a case, unbiasedness and consistency properties of the estimator will be violated, because the structure of the model residuals will show a strong correlation through cross-section units, and these errors will no longer be independently and identically distributed. In fact, unobserved common and heterogeneous factor loadings will be part of the error member of the relation ei,t. In this case, the problem of bias arises because important independent variables have been omitted ( omitted-variable bias) and the observed explanatory variables will be correlated with unobserved common factors. By rejecting the null hypothesis of the Pesaran test, the OLS estimation becomes inconsistent (Everaert and de Groote, 2016).
The Pesaran test shall be performed prior to the use of an estimator with CCE factors to determine whether there are cross-sectional dependencies in the data (shown in the main results table). A model with CCE factors is then used and the test is applied in a standard way after modelling has been performed in order to obtain information on the representativeness of estimates. Model estimation follows.
4 Results of empirical research
4.1 Results of analysis for Croatia
Before the model estimation, it is important to obtain basic information about the time series of variables, and above all about the presence of unit root in the series. Indeed, the estimation of the ARDL model allows a combination of variables that are integrated and of orders 0 and 1, i.e. both variables that are stationary in levels and those that are stationary after the transformation in the first differences but does not allow analysis with variables that are also I(2) (integrated to the second order). In case of I(2), the OLS method encounters estimation difficulties. Also, if all variables are I(0), the purpose of calculating long-term coefficients is questionable. For this purpose, the Augmented Dickey-Fuller test (ADF) of the unit root is used, where the null hypothesis of the test assumes non-stationarity of the time series. The test results (available on request) suggest that the K, IN and LP variables are all I(1), allowing the analysis to continue. Table 2 shows model results with estimated long-term coefficients.
For Model (1), the results indicate a long-term significant relationship between K and LP at all standard levels of significance, with EC being of the correct sign and implying a 60.4% reduction of imbalance in the first year. The results of the PSS test also indicate long-term correlation of variables, with long-term parameters being significant at the level of 10%, with the EC member reaching significance at the level of 5%. On the other hand, the results indicate that the long-term coefficient with IN is not significant. In the model variant without K, the long-term coefficient with IN is still not significant, while the null hypothesis of the PSS test cannot be rejected, which indicates that there is no real long-term link between intangible capital and labour productivity in Croatia.
Table 2Model estimation with long-term coefficients, Croatia DISPLAY Table
To further establish the relationship between variables, the Engle-Granger ( 1987)- type procedure was carried out in two phases. The results (available on demand), in the variant with and without factor K, indicate that the variables are not long-term related, as the residual time series in both variants of long-term relationship are non-stationary and indicate different long-term dynamics. Also, the results of the error correction model suggest a short-term significant effect of K on LP, but not on IN. Although the results obtained are based on a limited sample, they nevertheless systematically imply that K significantly influences labour productivity in Croatia. Conversely, the effect of IN on LP is not statistically significant in any variant of different specifications, indicating that there are no adequate conditions for additional productivity growth based on intangible capital. The results obtained will be compared with estimates for highly developed countries.
4.2 Results of panel analysis for highly developed economies
Here again, performing the unit root test is useful for analysing long-term relationship of variables, because the reasons explained in the first part also apply to the panel analysis. Here we use the Pesaran CIPS test (Cross-sectionally augmented Im-Pesaran-Shin), which assumes the possibility of cross-sectional dependence. Test results (available on demand) suggest combinations of I(0) and I(1) variables, i.e. none of the variables are I(2). The results of regression models follow, first for sectoral data of the estimated DCCE-PMG and DCCE-MG methods (table 3).
Model results based on DCCE-PMG estimator indicate that long-term coefficients at K and IN are positive and significant (IN is significant even without the inclusion of K). The estimator with the EC is significant and with a negative sign, as expected. The results of the Pesaran test indicate that the decision to remove cross-sectional dependence from the residuals of the estimated models in the PMG variant and to include cross-sectional averages was correct. In the model variant without the CCE factor, the null hypothesis is rejected, which implies a significant level of dependence in model residuals. Conversely, after the inclusion of cross-sectional averages, the null hypothesis cannot be rejected, and the resulting estimates can be considered unbiased.
For the DCCE-MG model, which assumes the heterogeneity of long-term coefficients (Model (3)), coefficients with K and IN are no longer significant. However, as the null hypothesis of the Pesaran test is rejected, these results cannot be considered reliable. On the other hand, in the model variant without K (4), the coefficient with IN is significant and positive, and cross-sectional averages effectively remove dependence from residuals, as indicated by the Pesaran test.
Table 3Model estimations with long-term coefficients, sectoral panel data for thirteen highly developed countries DISPLAY Table
The results of the Pedroni cointegration test are shown at the bottom of the table. In both the combined and heterogeneous model variants, the test statistics indicate the rejection of the null hypothesis which assumes the absence of long-term relationship (assuming the non-stationarity of model residuals). Based on all these results, we can conclude that for sectoral data in the panel of highly developed countries, the impact of K and IN on LP is significant. For further examination of sectoral results, the appendix (table A1) provides additional dynamic and static estimations, which mainly support additional findings of DCCE-MG and DCCEPMG estimators, especially as regards the long-term impact of IN on LP.
The following are estimates of aggregate data from the same set of countries (only without the UK) (table 4), which are used to further compare the results. As with sectoral data, aggregate data estimation models using PMG variant methods point to long-term significance of coefficients IN and K, and the results of the Pesaran test again point to effective elimination of cross-sectional dependence by adding cross-sectional averages to equations. The results of the Pedroni test in the pooled variant support the conclusions of the model on significant long-term relation.
On the other hand, results of the version using MG estimator are not so clear. Specification (3) with K and IN included shows no significance at θi. Variant (4) without K shows significance of the positive long-term coefficient, but the results of the Pesaran test fail to point to a single conclusion. However, the results of the Pedroni test in the heterogeneous version support the conclusion on long-term connection between variables. All of this, together with findings of the models using sectoral data from highly developed countries, point to a positive and significant long-term effect of both K and IN on LP.
Table 4Model estimations with long-term coefficients, aggregate panel data for twelve highly developed countries DISPLAY Table
5 Discussion and conclusion
The methods used and the results obtained from the estimated models with data for Croatia and panel data from highly developed countries indicate potentially important differences in the contribution of intangible capital to the growth of labour productivity in these economies. Estimates indicate that labour productivity in Croatia is affected more by physical rather than intangible capital per hour. On the other hand, comprehensive model estimates with panel data for highly developed economies indicate a significant impact of both types of capital on long-term productivity. This means that in an equilibrium state (where variables are not liable to short-term shocks), the unit increase in intangible capital per hour of work does not have a significant lasting effect on labour productivity in Croatia but does so in advanced economies. Clearly, the role of institutional and development factors that enable productivity to grow is important, both through physical and intangible capital. More favourable institutional and development conditions and environment favour the use of intangible capital, which leads to faster productivity growth and thus faster real income growth per capita. This can partly explain differences in the level of economic development of Croatia and selected highly developed countries.
In the case of Croatia, only significant channel of productivity growth through K can lead to a stagnation of productivity growth when the country reaches the level of development at which further investment in physical capital brings little marginal benefits for productivity. Therefore, without the significant role of the IN channel, neither continued long-term productivity growth nor higher income per worker can be expected. This is also indicated by the research referred to in the literature review.
Furthermore, applying intangible capital to the economy requires a high level of human capital and a development environment that will encourage companies to make the structural investments necessary to increase productivity. The state should therefore establish a stimulating institutional and development environment necessary for the growth of labour productivity and economic development. The results of this empirical survey can be compared to the latest edition of the Global Innovation Index for 2025 (GII), which can partially mirror the institutional success of a country, as it explains the development of its innovative capacities (WIPO, 2025).
Croatia ranks 40th among 139 countries in the Global Innovation Index. According to the sub-components of this Index, Croatia has particularly poorly developed key institutional support (65th place), which indicates that more developed formal institutions, including practical efficiency of regulatory processes, would facilitate investment and growth of investments in intangible capital and lead to potential productivity growth. Furthermore, equality of all companies before the law (which again indicates the importance of formal institutions) would allow for a greater number and capacity of newly created fast-growing enterprises whose intangible capital investments would lead to their higher productivity and returns, which would have a positive impact on the whole economy.
Furthermore, Croatia ranks relatively poorly both in business (53 rd place) and market (54 th place) sophistication, indicating a lack of adequate basic sophisticated infrastructures for further productivity growth based on intangible capital. Therefore, the public sector’s contribution to the development of intangible capital is essential, or as Aghion and Howitt ( 2006) state, well-designed economic policies that will stimulate growth of IN (subsidies, tax breaks and reliefs) are essential.
In more practical sense, Croatia as EU member state should consider a more efficient and structured decision-making process on how to spend assets from EU development funds. Related to the market sophistication rank, the development of financial markets could contribute to the relocation of labour and capital to the most efficient and most innovative but potentially risky companies is also very important (Aghion and Howitt, 2006).
This would stimulate the growth of IN and hence LP. Furthermore, 40th position in human capital rankings indicates that further reforms of the higher education system leading to higher levels of human capital, necessary for effective use of IN, are needed, as indicated by the papers cited in the literature review.
The introduction of such development policies in the long run could help reduce the productivity gap and speed up Croatia’s convergence towards the average real income per capita of the most developed EU member states. On the other hand, the sampled advanced countries from this study are ranked as follows: Sweden (2), United States (3), United Kingdom (6), Finland (7), Netherlands (8), Denmark (9), Germany (11), Japan (12), France (13), Austria (19), Italy (28), Spain (29); and Czechia (32). These rankings point to their superior institutional development, which is then evident in the results of the econometric analysis which are in line with important theoretical findings on the role of the institutional environment on productivity growth and the economic development (Aghion and Howitt, 2006).
Therefore, arguments built by this research, according to which institutional development positively influences the transition of productivity growth based on accumulation of physical capital per worker (or hours) with a parallel imitation of technologies already created towards intangible capital and the creation of new innovations (Acemoglu, Aghion and Zilibotti, 2006), are partially confirmed by the results of econometric analysis and supported by the results of the GII. However, without further empirical testing and adequate analysis of institutions and the historical and cultural context, we should be careful when discussing the causal role of institutions and intangible capital in productivity growth.
However, looking at A1 charts, the results and model estimates in this paper are not surprising, because in the last available year (2021) and during the period 1995- 2021, Croatia was almost continuously at the bottom when looking at the intangible capital stock when compared to highly developed countries in the sample. These are significant deficiencies in infrastructure and development conditions necessary for a significant effect of IN on productivity, which can also be seen in the trends in labour productivity per hour during this period (figure A2). Croatia is constantly at the bottom relative to this criterion as well in comparison with highly developed countries.
Finally, the shortcomings of this, as well as possible recommendations for further research, should be noted. First, an important control variable – the level of human capital explaining the important link with intangible capital in the contribution to productivity – was omitted. However, as sectoral data are also used in the paper, the calculation of such an indicator would be too demanding at the moment. Therefore, the impact of human capital levels on labour productivity and the impact of patents and innovations should be analysed in future works, especially in Croatia where this has been poorly investigated. Furthermore, with the help of sectoral data, the link between K and IN with LP could be investigated in a more detailed and precise way, for which it is necessary to build adequate databases for sectors or even companies in Croatia. Finally, it is necessary to note that the data used in this study from the EU KLEMS database, while highly useful, are undoubtedly subject to statistical errors and inaccuracies. They should therefore be regarded as approximations of capital stock and productivity. Nevertheless, researchers will likely recognize that the data presented in this database do not differ substantially from other comparable sources available.
Appendix
Table A1Additional dynamic and static estimations of the equation of effect of IN and K on LP DISPLAY Table Figure A1Intangible capital stock per hour of work, in euros and permanent prices (1995-2021), all NACE Rev. 2 activities DISPLAY Figure Figure A2Labour productivity measured in gross added value per hour of work, in euros and permanent prices (1995-2021), all NACE Rev. 2 activities DISPLAY Figure
Notes
* The author is grateful to two anonymous referees who have contributed to the quality of the final version of the paper. Views and opinions expressed in the paper are the author’s own and do not necessarily reflect the policies or views of the Croatian National Bank.
* The author is grateful to two anonymous referees who have contributed to the quality of the final version of the paper. Views and opinions expressed in the paper are the author’s own and do not necessarily reflect the policies or views of the Croatian National Bank.
Disclosure statement
The author has no conflicts of interest to declare.
References
Acemoglu, D., Aghion, P. and Zilibotti, F., 2006. Distance to Frontier, Selection, and Economic Growth. Journal of the European Economic Association, 4(1), pp. 37-74 [ CrossRef]
Aghion, P. and Howitt, P., 1992. A Model of Growth through Creative Destruction. Econometrica, 60(2), pp. 323-351 [ CrossRef]
Aghion, P. and Howitt, P., 2006. Appropriate Growth Policy: A Unifying Framework. Journal of the European Economic Association, 4(2-3), pp. 269-314 [ CrossRef]
Baldwin, J. [et al.], 2009. Investment in Intangible Assets in Canada: R&D, Innovation, Brand, and Mining, Oil and Gas Exploration Expenditures. The Canadian Productivity Review, No. 26 [ CrossRef]
Benhabib, J. and Spiegel, M. M., 1994. The Role of Human Capital in Economic Development – Evidence from Aggregate Cross-Country Data. Journal of Monetary Economics, 34(2), pp. 143-173 [ CrossRef]
Blundell, R. and Bond, S. R., 1998. Initial conditions and moment restrictions in dynamic panel data models. Journal of Econometrics, 87(1), pp. 115-143 [ CrossRef]
Bontadini, F. [et al.], 2023. Euklems and IntanProd: industry productivity accounts with intangibles. MPRA Paper, No. 126218.
Bontempi, M. E. and Mairesse, J., 2015. Intangible capital and productivity at the firm level: a panel data assessment. Economics of Innovation and New Technology, 24(1-2), pp. 22-51 [ CrossRef]
Brynjolfsson, E., Hitt, L. M. and Yang, S., 2002. Intangible Assets: Computers and Organizational Capital. Brookings Papers on Economic Activity, 1, pp. 137-198 [ CrossRef]
Castelli, C. [et al.], 2024. Tangible, intangible assets and labour productivity growth. Journal of Economic Studies, 51(9), pp. 272-289 [ CrossRef]
Chudik, A. [et al.], 2013. Debt, Inflation and Growth: Robust Estimation of Long-Run Effects in Dynamic Panel Data Models. CAFE Research Paper, No. 13.23.
Chudik, A. and Pesaran, M. H. (2015). Common correlated effects estimation of heterogeneous dynamic panel data models with weakly exogenous regressors. Journal of Econometrics, 188(2), pp. 393-420 [ CrossRef]
Chudik, A., Pesaran, M. H. and Tosetti, E., 2011. Weak and strong cross-section dependence and estimation of large panels. Econometrics Journal, 14(1), pp. 45-90 [ CrossRef]
Corrado, C., Haskel, J. and Jona-Lasinio, C., 2017. Knowledge Spillovers, ICT and Productivity Growth. Oxford Bulletin of Economics and Statistics, 79(4), pp. 592-618 [ CrossRef]
Corrado, C., Hulten, C. and Sichel, D., 2009. Intangible Capital and U.S. Economic Growth. The Review of Income and Wealth, 55(3), pp. 661-685 [ CrossRef]
Crass, D., Licht, G. and Peters, B., 2015. Intangible Assets and Investments at the Sector Level: Empirical Evidence for Germany. In: A. Bounfour and T. Miyagawa, eds. Intangibles, Market Failure and Innovation Performance. Cham: Springer, pp. 57-111 [ CrossRef]
Ditzen, J., 2021. Estimating long run effects and the exponent of cross-sectional dependence: an update to xtdcce2. The Stata Journal, 21(3), pp. 687-707 [ CrossRef]
Eberhardt, M., Helmers, C. and Strauss, H., 2013. Do Spillovers Matter When Estimating Private Returns to R&D? The Review of Economics and Statistics, 95(2), pp. 436-448 [ CrossRef]
Engle, R. F. and Granger, C., 1987. Co-integration and error correction: Representation, estimation, and testing. Econometrica, 55(2), pp. 251-276 [ CrossRef]
Everaert, G. and De Groote, T., 2016. Common correlated effects estimation of dynamic panels with cross-sectional dependence. Econometric Reviews, 35, pp. 428-463 [ CrossRef]
Fukao, K. [et al.], 2009. Intangible Investment in Japan: Measurement and Contribution to Economic Growth. The Review of Income and Wealth, 55(3), pp. 717-736 [ CrossRef]
Griliches, Z. and Mairesse, J., 1998. Production functions: The search for identification. In: S. Steinar, ed. Econometrics and Economic Theory in the Twentieth Century: The Ragnar Frisch Centennial Symposium. Cambridge University Press, pp. 169-203.
Griliches, Z., 1981. Market value, R&D, and patents. Economics Letters, 7(2), pp. 183-187 [ CrossRef]
Griliches, Z., 1995. R&D and productivity: econometric results and measurement issues. In: P. Stoneman, ed. Handbook of the Economics of Innovation and Technological Change. Oxford: Blackwell Publishers Ltd.
Grossman, G. and Helpman, E., 1991. Quality ladders in the theory of growth. Review of Economic Studies, 58(1), pp. 43-61 [ CrossRef]
Hao, J. X., Manole, V. and Van Ark, B., 2009. Intangible Capital and Growth: An International Comparison. COINVEST Working Paper D3.6.
Hintzmann, C., Lladós-Masllorens, J. and Ramos, R., 2021. Intangible assets and labour productivity growth. Economies, 9(2), 82 [ CrossRef]
Kripfganz, S. and Schneider, D. C., 2020. Response surface regressions for critical value bounds and approximate p-values in equilibrium correction models. Oxford Bulletin of Economics and Statistics, 82(6), pp. 1456-1481 [ CrossRef]
Kripfganz, S. and Schneider, D. C., 2023. ardl: Estimating autoregressive distributed lag and equilibrium correction models. The Stata Journal, 23(4), pp. 983-1019 [ CrossRef]
Nakamura, L. I., 2010. Intangible Assets and National Income Accounting. The Review of Income and Wealth, 56(1), pp. s135-s155 [ CrossRef]
Pedroni, P., 2004. Panel cointegration: Asymptotic and finite sample properties of pooled time series tests with an application to the PPP hypothesis. Econometric Theory, 20(3), pp. 597-625.
Pesaran, M. H., 2004. General diagnostic tests for cross section dependence in panels. Cambridge Working Papers in Economics, No. 435 [ CrossRef]
Pesaran, M. H., 2007. A simple panel unit root test in the presence of cross-section dependence. Journal of Applied Econometrics, 22(2), pp. 265-312 [ CrossRef]
Pesaran, M. H., 2015. Testing weak cross-sectional dependence in large panels. Econometric Reviews, 34: 1089-1117 [ CrossRef]
Pesaran, M. H., Shin, Y. and Smith, R. J., 2001. Bounds testing approaches to the analysis of level relationships. Journal of Applied Econometrics, 16, pp. 289-326 [ CrossRef]
Romer, P., 1990. Endogenous Technological Change. Journal of Political Economy, 98(5), pp. 71-101 [ CrossRef]
Roodman, D., 2009. A note on the theme of too many instruments. Oxford Bulletin of Economics and Statistics, 71(1), pp. 135-158 [ CrossRef]
Rosser, J. B. and Rosser, M. V., 2018. Comparative Economics in a Transforming World Economy. The MIT Press.
Roth, F. and Thum, A.-E., 2013. Intangible Capital and Labor Productivity Growth: Panel Evidence for the EU from 1998-2005. Review of Income and Wealth, 59(3), pp. 486-508 [ CrossRef]
Roth, F., 2020. Revisiting intangible capital and labour productivity growth, 2000-2015: Accounting for the crisis and economic recovery in the EU. Journal of Intellectual Capital, 21(5), pp. 671-690 [ CrossRef]
Solow, R. M., 1987. We’d better watch out. New York Times Book Review, 36.
Van Ark, B. and O’Mahony, M., 2016. Productivity Growth in Europe before and since the 2008/2009 economic and financial crisis. In: D. Jorgensen, K. Fukao and M. P. Timmer, eds. The World Economy: Growth Stagnation. Cambridge: Cambridge University Press, pp. 111-152 [ CrossRef]
Van Ark, B., 2016. Europe’s Productivity Slowdown Revisited: A comparative perspective to the United States. In: P. Askenazy, eds. Productivity Puzzles Across Europe. Oxford: Oxford University Press, pp. 26-48 [ CrossRef]
Windmeijer, F., 2005. A finite sample correction for the variance of linear efficient two-step GMM estimators. Journal of Econometrics, 126(1), pp. 25-51 [ CrossRef]
|


