|
|
|
Abstract
This paper is a first theoretical presentation of a simple progressive taxation system. The system is based on two adaptations of one easily calculable formula that is based on the societal average income of the previous year. The system contributes to academic discussions as it is a novel approach. It is a progressive tax that does not discriminate against anyone as the progression increases continuously and the increase in tax payment does not go beyond the additional income. The analysis in the paper shows that the core advantage of the system is its simple, transparent and adaptable mechanism.
Keywords: taxation ; flat tax ; progressive tax ; taxation efficiency
JEL: H21, H24
1 Introduction
Complicated taxation systems do not only lead to a significant increase in administrative costs for all parties involved, but they can also lead to unjustified tax exemptions and loopholes. This paper introduces a concept for a simple progressive taxation system, which enables citizens, the economy and the state to save significant amounts of money by decreasing the time invested in administering the taxation process. The concept facilitates fast tax reporting and also a fast and simple auditing process, which saves time and money for all stakeholders. The simplicity of the system makes it calculable for anyone and creates transparency within the system. The simplicity extends to the optimization of the tax rate and progression, if it is in the interest of the political power to change one of the factors. The proposed concept employs only two simple formulas and closes most loopholes in the tax code with this simplicity. The simple progressive tax (SPT) enables hence a transparent process for all citizens and they have the same process to go through without differentiation. It is a progressive counterpart to the flat tax. In contrast to the flat-tax concept, the SPT obviates several of the current conflicts regarding income inequality and some of the usual dilemmas of progressive taxation systems. In the existing literature on taxation, such a system is still missing and this paper tries to shed light on this important gap.
This article is a first theoretical introduction to the concept. The first demonstration of the SPT concept is provided by simplified examples. A simple quantitative comparison of the results of the SPT with those of the current taxation systems of Germany and Estonia is offered. The two countries have very different approaches towards taxation: Germany with its progressive and complex system and Estonia with its flat tax system. For this first introduction, we limit our analysis to these two countries in order to keep the paper understandable. The goal is to show the differences of the SPT for two diametrically different taxation systems. The system proposed aims to combine the beneficial parts from both systems in order to facilitate the creation of a potentially simple progressive taxation system.
The empirical part shows that the SPT works as claimed and emphasizes the differences to the systems that are currently in place. It also shows that the SPT provides a slow and long-lasting progression, which might create a system that does not affect any taxpayer over proportionally. The study uses the Luxembourg Income Study Database and the German statistical office data. The remainder of the paper is organised as follows: section 2 discusses different theories behind taxation systems in order to explain the rationale behind the SPT, section 3 describes the SPT in theory and section 4 discusses the dataset while section 5 provides some first empirical example cases. Section 6 discusses the potential outcomes from the application of the theoretical model while section 7 concludes the paper.
2 Flat and progressive taxation: a brief overview
Going briefly back into history, it becomes obvious that taxation depends highly on the individual perception of justice and fairness. Frank ( 1995) illustrates that in medieval times a system close to the modern flat-tax approach was already introduced, for in feudal Europe taxation consisted of the land owners taking a fixed proportion of agricultural production. In Leviathan, 1651, Hobbes (2006) argued that individuals should be taxed in proportion to the benefits they received from the state, which is measured by consumption and not by income or property. For him, the link between proportionate taxation and the use of consumption as a tax base is not necessary even if that relation is common among those who support the single-rate taxation. 1995) illustrates that in medieval times a system close to the modern flat-tax approach was already introduced, for in feudal Europe taxation consisted of the land owners taking a fixed proportion of agricultural production. In Leviathan, 1651, Hobbes (2006) argued that individuals should be taxed in proportion to the benefits they received from the state, which is measured by consumption and not by income or property. For him, the link between proportionate taxation and the use of consumption as a tax base is not necessary even if that relation is common among those who support the single-rate taxation.
Adam Smith, in his iconic work The Wealth of Nations ( 1776), muddled his stance on progressive taxation. He claims: “It is not very unreasonable that the rich should contribute to the public expense not only in proportion to their revenue, but something more than in proportion”, but he endorsed proportional rates, suggesting that “subjects of every state ought to contribute towards the support of the government, as nearly as possible in proportion to their respective abilities, that is in proportion to the revenue which they respectively enjoy under the protection of the state” (Smith, 1776, V.II.I. p. 911). In fact, Smith’s argument for proportionality seems more consistent with his broader discussion on taxation.
Flat-tax supporters often refer to John Stuart Mill’s work ( 1852), recalling his observation that progressive taxes were “a mild form of robbery”. However, Mill endorsed digressive taxation, with an exemption to allow for necessities. Seligman (1894) believed that this deviation from true proportionality vitiated Mill’s entire case for flat rate taxes, opening the door to any sort of progressive rate structure. The introduction of the concept of flat tax has its roots in the mid-twentieth century as a product of the conservative intellectual renaissance from the USA. In 1962, Friedman discussed progressive taxation. He preferred a flat-rate income tax 1 also as a means to alleviate poverty. Milton Friedman hence relaunched the idea of competition between proportional and progressive taxation (Friedman, 1962). Hayek ( 1960) also developed arguments against the idea that progressive taxation is essential to ensure a redistribution of income in favour of the poor.
One particularly interesting approach for finding a just income taxation system, developed by Bamford ( 2015), is the hourly average approach. It is based on the average of two key figures. The first is the lifetime-worktime indicator, which is a bundle of all working hours accumulated over a person’s life. The second is the lifetime income, which is the indicator for all income earned over the lifetime already lived. These numbers get accumulated and averaged. The outcome then is an average hourly income. This average can be the basis for the particular tax burden. In the concept, the burden would increase with a higher average income per hour (Bamford, 2015). The system may not be very practical, but it respects the aspect of earning per hour which the “normal” taxation system does not take into account. Additionally, this is one of the few average-income-based taxation systems in existence.
2.1 Flat taxation
Hayek and Friedman advocated a flat tax (Friedman, 1962; Hayek, 1956, 1960). The original starting point for flat taxes was Hall and Rabushka’s book (1983). The flat tax system grew in Europe in the years after the collapse of the Soviet Union and the European Union enlargement to post-communist countries that have adopted such systems.
Hall and Rabushka ( 1983) are the pioneers in academic works about flat tax and they consider a single tax rate applied to both personal and corporate income beyond a given threshold or “basic allowance”, but in practice none of the countries mentioned above have adopted a pure flat tax system. The concept of a flat tax is much more discussed in the USA than in Europe and it has created a debate both in the academic and in the political sphere. The European discussion took shape on the shores of the Baltic Sea, when Estonia enacted a flat-rate income tax in 1994. Since 2001, other Central and Eastern European (CEE) countries have followed the Estonian example (Keen, Kim and Varsano, 2006).
In post-communist CEE countries, the introduction of the flat tax has developed since 1994, when Estonia was the first European country to introduce it. In the meantime, other CEE countries have followed its example. 2 Estonia replaced a progressive personal income tax-rate system (16, 24 and 33, and 50 per cent) with a proportional 26 per cent rate in 1994, gradually reduced to 20 per cent by 2015 and still standing at 20 per cent (Trasberg, 2011; Estonian Tax and Customs Board, 2019).
Some countries have maintained different income and corporate tax rates. In most cases flat tax refers only to income tax. The political and economic debates in Eastern Europe have been dominated by discussions about flat tax for almost twenty years (Evans and Aligica, 2008).
Nowadays, the European countries that have adopted the flat-tax system are all former Communist nations (except the Channel Islands). The core idea of the flattax concept is that everybody pays the same tax rate regardless of income or fortune. This pure form of proportional taxation is obviously not the only possible design that has been developed over the years.
Only a few empirical studies have considered previous flat-tax reforms in detail. The most attention has been paid to the Russian flat-tax reform of 2001 (Gorodnichenko, Martinez-Vazquez and Peter, 2008). They used the Difference-in-Differences approach to study the effects of Russia’s flat-rate income-tax reform on consumption, income and tax evasion. Their findings show that the adoption of a flat-rate income tax is not expected to lead to significant increases in tax revenues, and although they find tangible efficiency gains from the tax reform, they are not as large as implied by conventional approaches. Reynolds ( 1999) discusses how Hong Kong has had a flat tax for more than half a century after the Second World War, similar to the Channel Islands (Fuest, Peichl and Schaefer, 2008), but Hong Kong and the Channel Islands are not independent or autonomous nations like Estonia, the first European country to introduce a flat rate of 26 per cent on personal income and corporate profits in 1994.
Fuest, Peichl and Schaefer ( 2008), using income-tax microdata and household survey data, asked whether a flat tax would be feasible in Germany. Their study shows that a flat-rate tax with a low tax rate and a low basic allowance yields positive static welfare effects amounting to approximately 1.8 per cent of income-tax revenue, but it increases income inequality at the same time. In their model, the increase in income inequality can be avoided by combining a higher tax rate with a higher basic allowance, and in that case, the efficiency gains vanish. Their conclusion is that due to their limited efficiency effects and the problematic distributional impact, flat-tax reforms are unlikely to spill over to Western European countries.
The introduction of flat-rate tax systems is associated with a possible boost in efficiency, employment and growth through simplification and better incentives, but at the same time it is associated with an increase in inequality. Keen, Kim and Varsano ( 2006) stressed that the empirical evidence on the effects and impact factors of the flat tax is limited to several countries that have adopted it in recent years, but they found no sign of Laffer-type behavioural responses, which means that tax cuts would generate revenue increases. Paulus and Peichl ( 2009) studied the possibility of applying a flat tax in Western European countries using simulation and the EUROMOD dataset, given that flat taxes have not yet been implemented in Western European countries. In their paper, they claim that in most countries the relative loss in disposable income is high or even highest for middle-income households. If the importance of these groups for the political process in Western Europe is taken into account and correlated with the effects of a flat tax system, it might be possible to explain why Western European countries are not keen on introducing a flat tax.
No implemented flat-tax system meets all the additional requirements needed for an “orthodox” flat tax (as proposed by Hall and Rabushka, 1983), namely that there be no tax on savings (including pensions), no tax on foreign earnings, no tax on capital gains, no tax on inheritances, no tax on charities, no allowances and reliefs, while business be taxed on cash flow and not on profits (Murphy, 2006).
One argument important for the advocates of a flat tax is that it would help to improve tax collection by lowering tax evasion, broadening the tax base and increasing the budget revenues. Keen, Kim and Varsano ( 2006) show in their paper that the revenues from the personal income tax, as share of GDP, dropped in Estonia in the first year after the introduction of a flat tax. In terms of fiscal pressure for low-income earners, Staehr ( 2004) mentions that the flat tax might be a factor leading to societal fragmentation and unemployment.
Turning a flat tax into a progressive tax by adding tax-free thresholds would be the closest to the concept proposed here. The difference is that the SPT works without stages, barriers or limits, it is transparent and treats all income receivers equally, by applying the same two formulas to each individual. The SPT is also based on the societal average income and hence relates the individual tax rate to the income distribution in the society. There are no levels that might prevent employees from aiming to gain more, by requiring them to pay more taxes than income gained. There is also no mid-income trap or any issue similar to this. Each euro of additional income is taxed more than the last one, but the taxation system never eliminates the gain entirely. Every income is beneficial to the individual gaining it, regardless if the person is in the lowest or the highest quantile of the income distribution.
The undeniable advantage of a flat tax is that the administrative costs and the time required are rather low for all parties involved. This is also one of the core strengths that the SPT is built on.
A hypothesis that we would like to test in another paper is that simplicity might be able to promote legitimacy among the population, which might be of particular interest for governments in times like these. The SPT would provide such an advantage for the government, but further research would be required to find out if such a hypothesis can hold up.
2.2 Progressive taxation
The impact of every progressive system depends hugely on its particular design. There are rather extreme cases of progressivity, in which authors call for a taxation in which the highest incomes within a society should be taxed with increasing marginal rates, while low incomes should receive tax subsidies (Diamond and Saez, 2011), but this is not a necessary condition for a progressive taxation system.
Support for a progressive system comes from the idea of giving the poor a chance to alleviate their situation (Schweiger, 2015). Another argument is given by the theory of positional externalities, which claims that people with higher incomes spend more money on positional goods, like art, luxury cars or larger houses that do not provide a lot of utility except for prestige. These investments would decrease with a progressive tax and would enable an investment of the money into public goods (Krueger and Ludwig, 2016).
In Germany, one basic tendency that dominated the taxation debate over the last few decades was mentioned by the German Federal Constitutional Court in 1992. The basis for tax estimations should not just reflect income, but it should also recognize the momentary situation in the economy and the existential needs of the citizens (BVerfGE 87, 1992153). According to a study from 2010, most German taxpayers are in favour of a progressive tax anyway. The important question remains how to design and justify such a system (Hennighausen and Heinemann, 2010).
Effectively, Germany has a taxation system that has progressive tendencies and thus already reduces income inequality, but the system is rather complex and high in administrative costs (Bach, Corneo and Steiner, 2006). Schweiger ( 2015) has emphasized the ability-to-pay argument and the argument of limiting inequalities against flat taxes. The ability-to-pay argument is the idea that every citizen should pay a tax that is not overburdening, which means that the taxation should respect the need of poorer citizens to invest a higher share of their monthly income in their costs of living than richer citizens. Limiting inequality is an intrinsic idea for the social state, which tries to enable the poorest to emerge from their poverty and thus needs the richest to pay a higher share of their income (Schweiger, 2015). Both of these arguments might lead to the outcome that a progressive tax could be seen as closer to a just taxation system than a flat-tax system. However, these are only two arguments, and the personal perception of justice remains subjective. These perceptual differences have led to so many different systems that the flat tax is only one of many (Nerré, 2008), but for this paper the example is important as it can help to clarify the purpose, advantages and effectiveness of a simple system.
Kirchhof ( 2010), for example, has argued for years for a simplification of the German taxation systems. In his paper, he wrote that the taxpayer has to pay, just because she or he is able to do so because of the individual financial situation and not because she or he did not use the legally provided or accepted circumvention mechanisms. Taxation should not be a matter of tactics or strategy; it should be a process with an open visor, a card game with open cards and not the game of cat and mouse triggered by the current system. Kirchhof also made a big leap forward with the “Heidelberger Entwurf”. The concept planned to reduce the more than 30 German taxes to four taxes: one income tax, one sales tax, one estate, inheritance and gift tax and one excise tax (Kirchhof, 2010). Only a few things out of those proposals were actually put into law in the end, but the approach to simplify triggered a large public discussion in Germany (Rixen, 2010).
3 Theoretical proposal for a simple progressive taxation
The simplification aspects of the concept presented in this paper are based on similar ideas to those of Kirchhof, but SPT could move the simplification one step further, as it would be able to minimize the number of taxes to only two. An income tax that could also be used as a corporate tax, with some small alterations from the original design. A sales tax, which would be built on the same formula, but the indicators have to be different to make the system appropriate. Other taxes that are implemented to trigger behavioural incentives, like taxes on tobacco or sugar are not considered in this analysis, as they are created through the interest of public health, public security or something else and are not actually implemented for the pure need to finance the public administration.
This paper presents the system only as an income tax which is able to resolve several current conflicts regarding income inequality and regarding the consequences of complex taxation systems. The system we present can be designed in a way similar to the design presented in this paper, but it does not have to be so interpreted or designed. The formula is first of all an inspiration for further thought and its design is intended to facilitate the administration of the taxation system and to facilitate an individual optimization for the country applying it.
Additionally, a tax system is always one of the most direct and relevant points of contact between a state and the day-to-day lives of its citizens. The picture of a bureaucratic and wasteful public administration is strongly supported by a complex and even confusing taxation system. A formula which is understandable and calculable for everyone, on the other hand, might be able to give a more positive image to the taxpayers, and it might be able to show a closer proximity between the government, the administration and the citizens, but that is only an untested hypothesis that we would like to test in the future.
3.1 The theoretical model of the simple progressive tax
Our paper presents a simple taxation mechanism, which consists of two adaptations of one formula. The objective is to create a system that is easily understandable and fast to apply for all citizens. With increasing income the formula creates an increasing tax rate. The marginal tax rate never surpasses the marginal income gain. It is hence always beneficial for the individual to earn more. In this particular design of an income tax, all income, regardless of its source, is accounted for; hence it includes subsidies, transfers, inheritance, gifts, labour income and income from capital investment, interests and entrepreneurial activity. The point that gifts and inheritance are also included in this particular design is that it limits the incentives for strategic behaviour, but this issue will be discussed in detail later. This all including approach makes the income a rather general number and easy to control. In systems where simplicity is not the highest priority, inheritance and gift taxation could be excluded from income. An adaptation of the SPT to an inheritance tax system is easily possible and could hence be similarly easy to calculate. Such adaptation possibilities make the system flexible and simple, as there are very few exceptions and no entrance borders or layers. All people generating income within the country pay income taxes, beginning from the first euro, while keeping the distribution of the tax adapted to the capabilities of the individual.
Basing the formula on the societal average income eases the individual’s and societal income shifts by relating them to the development of the income of the entire society. It also automatically includes inflation and market-based income developments in every taxpayer’s taxation payments. This means that, if an employee works in a labour market and receives an income below the average income increase, she or he has to pay lower taxes in the following year. The main model follows formula (1), which is the baseline. This is the formula that every taxpayer has to calculate for her- or himself. The taxpayer only needs to include the personal income and the personal volume of donations, while the societal average income of the past year is published by a public entity. The system is also designed in such a way that the tax rate never surpasses the volume of the additional income, so that more income equals more income in every case – which is not necessarily the case in every progressive taxation system. 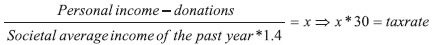 | (1 ) ) |
 |
|
Personal income in this case, as mentioned, includes capital income, gifts, inheritance and, generally speaking, all income accruing to the individual in that time period. For the empirical sections that follow the personal income is defined as the income upon which the current tax rate is calculated. The variable can hence be freely defined, but the simplicity and the distributional effects that the formula is supposed to trigger are most strongly achieved with an all-inclusive personal income definition. One-time incomes, such as gifts or inheritances and their fair accounting in the formula, as well as the variable donations, are discussed below. The denominators’ main variable, the societal average income of the past year, implies an administrative challenge, especially in the transitional years when the concept is not yet fully established, as the average tax payment of the past year cannot necessarily be calculated that fast. If that is the case the average should be calculated by the last year where the full data is available multiplied by the inflation rates that occurred between that and the current year.
The indicators of 30 and of 1.4 are exemplified numbers. They can be changed flexibly to increase or decrease the progressivity and the average tax rate according to the needs and wishes of the implementing state or entity. Nevertheless, these values and the possible maximal level of this formula have to be carefully levelled to one another so that they lead to a clean mathematical limit without distorting effects within the system. The value of 1.4 is used to lower the progressivity and spread the curve over a larger share of the population. If the indicator were closer to one, the steeper the progression would begin at lower income levels and the earlier the cut would be limited by the formula (4).
The impact factor of 30 has been chosen to create an average tax rate that lies close to a real average tax rate in Germany, as the resulting average tax rate is 21.43 per cent, i.e. the result of 30/1.4. These two indicators determine the progression as well as the effective average tax rate of the society. They are always strongly depending on another and need to be adapted together. A change of the tax rate factor from 30 to 45 would result in an average tax rate of 32.14, if the progression indicator were not adapted. If the progression indicator were changed to 2.0998 the resulting average tax rate would be 21.43, which produces exactly the same results under formula (1). The same accounts for the combination of 21.43/1. The same average tax rate can also be achieved via multiple combinations. The indicators can be chosen in any way, which means that the mathematical average of the tax rate can be zero or one hundred per cent as the other extreme. The indicators allow the implementing entity to steer the stronger progression to an earlier or later progression within the range of formula (1). Formula (4) is employed, the real function of the progression indicator comes into play as it allows the implementing state to create a progression that is steeper, as would be the case with the example of 21.43/1 or flatter as would be the case with the 45/2.0998 indicator. This claim is mathematically shown, based on the LIS dataset for Germany in 2007. According to the progression measure of Musgrave and Thin ( 1948) the 21.43/1 indicator combination has the highest Average Rate of Progression (ARP).
It is calculated as follows: 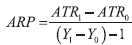 | (2) |

| (3) |
where ATR is the Average Tax Rate, Y0 and Y1 are the personal incomes of twohigh income individuals and T are the tax liabilities. Y0 and Y1 are example selections, in order to show the progression under formula II (eq. 4). The incomes hence only have to be in the highest income groups, in order to ensure the use of formula II.
The results in table 1 clearly show that the lowest progression indicator results in the strongest progression within the range of formula (4).
Table 1Average rate of progression DISPLAY Table
The influence of the indicators is hence multileveled and allows the implementing entity a rather broad freedom within the design of the taxation system that is supposed to be implemented.
The indicators also have to be calculated accordingly with the maximal level of x to enable a swift and fair transition to (4), the formula that applies only to wealthier taxpayers. If the indicators are not matched with each other and the beginning income for formula (4), a taxpayer earning more gross than another might end up earning less net, which is under no circumstances a just development.
Hence the purpose of the indicators 1.4 and 30 is to determine the tax rate and the progression. They are also responsible for a smoother increase in the tax rate and that no over-taxation of certain income groups occurs, thus a system that is fair to all citizens.
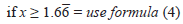
In the example that this paper uses to show the possibilities of the formula the tax rate, calculated with the first formula (1), is artificially limited to a spread from 0 per cent to up to 50 per cent. This artificial limit is implemented through the rule that if the tax rate of any taxpayer reaches a value that is x ≥ 1.66 ¯, which equals a tax rate of 50 per cent, formula (4) comes into play, and y becomes the tax rate for that person. Formula (4) is nothing but a small adaptation of formula (1). The difference between these two formulas is the second term of the formula. The progressivity of (4) is much smaller than that in (1), which is made to show that this formula enables the tax rate to spread over a longer span and hence to diversify the progressivity of the tax rate to a wider spectrum of the population. 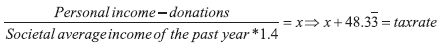 | (4) |
 |
|
The tax rates here vary between 50 per cent and 55 per cent, 55 per cent being the highest percentage possible. This is why the indicator 48.33¯ was chosen, as it adds up perfectly to the line of a 50-per cent tax rate. It adds up with a minimal x of 1.66¯, which is the minimal level of x that demands the use of formula (4).
Formula (4) is exemplified here for the purpose of showing the possibility of implementing a slow progressivity over a large share of the population and of showing that fair tax rates above the levels where formula (1) produces an over burdening progression are possible. The design of formula (1) leads to an almost exponential increase for the individual tax rate above that line, at least this is the case in most adaptations of the design. Formula (4) hence shows how a further increase in a tax rate could work under SPT. Formula (4) could obviously also work in lower percentage tax rates, but its progressivity is too slow to really be applicable to an entire society. Formula (1) creates a stronger progressivity that frees low-income citizens, especially the weakest in the society, from higher tax burdens, as the tax rate is bound to the average income of the society. If a person’s income lies beneath that line, he/she pays less than or equal to 21.43 per cent taxes. If the income is higher than the average, he/she pays more than 21.43 per cent taxes. This uneven number is a product of the design of the formula, which is created to keep the steepest areas of the progressivity above the line where formula (4) substitutes for formula (1). The calculation of the societal average income is based on the arithmetic median, as this simple method includes the outliers of the society, and it is more inclusive than other calculations of the society’s average. The additional upside for the taxpayer is that due to the high-income outliers, a higher societal average is calculated. This decreases the tax rate for all taxpayers in comparison to a tax rate based on the median or other means to calculate the average. Calculating formula (4) is only necessary for the higher-income receivers in the society. It has to be said that there is one weaker aspect regarding these two formulas. The transition between the two formulas cannot be perfect. The progressivity of formula (1) is higher than the progressivity of formula (4), and that means that someone who earns slightly less than the split has to endure a higher increase in tax rate on the next additional euro than someone who is slightly above the line, as the progressivity decreases. However, just to clarify, the real tax rate and the actual tax payment is always higher for the person earning more, regardless of the size of their income. The issue between the formulas is minimized by the positioning and design of the formulas, but it cannot be eliminated. The impact is rather small and could be ignored, but in the spirit of transparency, these aspects should be mentioned.
Regarding one-time incomes, like gifts or inheritance, it is important to note that they are dividable and spreadable over the years. The tax payment should be spreadable, in an equally distributed fashion over a maximum period of up to 25 years to enable a sufficient protection of the heir. The allowed period depends on the gap between inheritance and yearly average income. The wider the gap between these two is and hence the higher the inheritance or gift, the longer the period of distribution. As a rule of thumb, the maximal spread of the tax payment for inheritances or gifts should be distributed over one additional year per an increase of ten percentage points of the total income, over an averaged income period of five years. These calculations need to include inflation to eliminate gaming behaviour. In this way, an earlier payment is not a problem. The tax authorities have to be asked for permission to spread the income over the years. Every taxation system triggers particular incentives, and this system prides itself on triggering rather few incentives for gaming behaviour through its simplicity. It is a system that subjects everybody to the same easy mathematic basis, which ensures systemic fairness and equality, but individual needs cannot be taken into account, and hence absolute fairness cannot be guaranteed. Nevertheless, one important incentive that the system can trigger is the effect that larger inheritances and gifts are given or sold earlier and in smaller portions, so that a higher tax rate for the heir or benefiter of the gift is circumvented. This process is seen as acceptable, as it fulfils the purpose of the distributive effect of the tax system. The income loss for the state is acceptable, as a more continuous and earlier income flow is generated through the fact that private fortunes have to be shifted more actively and adequately in time to really enable an effect of saving for the taxpayers.
The system also minimizes the conflict of interest in the case of donations. Donations to publicly recognised charitable entities are deductible from the estimation base, which leads to the effect that a wealthier income taxpayer is able to profit disproportionally in comparison to a weaker taxpayer. The relative ability to donate increases with the increase of income, as a higher share of the income is not used for expenses of daily life. Nevertheless, the exception for donations is important regardless of its distorting impacts, as donations enable a more active and potent civil society. The supported entities not only enable a more socially engaged and active system, which makes them crucial for the life of a society, but they are able to take on tasks that otherwise the state would be obliged to cover. These entities are thus able to limit the expenditures for the state and limit the necessary tax income. They also limit a potentially all-surrounding state that has to occupy every inch of social life, as no private entities cover the unlimited number of socially, culturally or economically important aspects. To find a shared ground between these two aspects, a compromise of a maximum level of donations that is allowed to be deducted from the estimation basis of the tax formula is 5 per cent of the yearly income. This percentage is high enough to enable all donations, and the creation of foundations should not be endangered.
If the system was planned to be implemented for companies, as well, the limit for donation deduction would have to be lower for them due to the questionable influence that corporate social responsibility has (CSR) (Dahlsrud, 2008). Strict liberal theoreticians argued that profit was the only social responsibility of companies (Friedman, 1970), but today almost all administrations seem to disagree, as they implement rules to nurture CSR expenditures (Commission, 2013). Companies like CSR also because they can circumvent taxes and use it as a form of marketing. The public likes it as it makes brands more approachable and shows that a company cares. The last player in this equation is the state, which, in the cases of Italy and Germany, supports CSR activities (Porter and Kramer, 2002; Commission, 2013). Thus, all players seem to agree that this is an aspect worth nurturing, which is why the donations would remain within the formula even if it were supposed to be used for companies, as well.
4 Data
For our exercise, we used values from the Luxembourg Income Study data form of the years 2007 and 2010. LIS is a data archive and research centre dedicated to cross-national analysis, and it released two databases: the Luxembourg Income Study Database (LIS) and the Luxembourg Wealth Study Database (LWS). The third source of our data is a report by the German statistical office from 2015 about data from 2011 (DeStatis, 2015).
The LIS is the largest available income database of harmonised microdata collected from about 50 countries from around the world, while the LWS is the first cross-national wealth database in existence and includes variables on assets and debt, market and government income, household characteristics, labour-market outcomes and, in some datasets, expenditures and behavioural indicators.
The main variable we are interested in is the “gross household income”, which includes the total monetary payments from labour, property and social or private transfers. It also includes the total value of non-monetary goods and services received from labour and social or private transfers, excluding social transfers, such as universal health insurance, universal education benefits and near cash benefits from public housing.
In this first step of the concept, we use values for all workers without any distinction between full-time or part-time workers. We proceed to convert the values for Estonia into euros, given that in 2007 and 2010 Estonia was not yet in the European Monetary Union System.
We would also like to underline that this dataset does not contain any information about donations. This aspect forced us to ignore the impact factor “donation” for our examples in the following chapters. The aspect is important, but it does not change the underlying mechanism of the formula and can hence be ignored for the purpose of the examples.
5 Empirical comparison
The following tables show the tax volume payable for both countries and years. The data presented here intends to illustrate the progressivity, and it exemplifies the development of the tax rate under SPT. The small section of “Cut for (4)” is introduced to show the imaginary line that triggers the application of formula (4), and it shows how small the percentage of people is who actually have to pay 50 per cent or more taxes. Two additional tables that show the Estonian developments under the current system in 2007 and 2010 are in the appendix. These calculations describe the different progressions under the two formulas.
Table 2Simple progressive tax results Germany 2007 DISPLAY Table
Table 3Simple progressive tax results Germany 2010 DISPLAY Table
Table 4Simple progressive tax results Estonia 2007 DISPLAY Table
Table 5Simple progressive tax results Estonia 2010 DISPLAY Table
The tables show that the maximum level of 55 per cent is not reached until the top 1 per cent of income. They also show that the system produces a progression, as mentioned in the descriptive part above. The people with low income pay very low taxes while the tax rates increase substantially over the spectrum of incomes. Even though these numbers are not too detailed, they are able to show the general tendencies within a society and the general results of the formulas.
The results of formula (4) show that the richest one per cent of Estonians got slightly richer between the year 2007 and 2010, while the “Cut for (4)” moved down, which indicates that more taxpayers lost income in the same period.
However, regardless of such possible interpretations the tables show that the SPT would indeed provide a completely different taxation level for most taxpayers, while keeping the administrative costs low. The richest 25 to 30 per cent of the taxpayers would feel an increase in their tax volume, while the poorest 20 to 25 per cent would feel a significant tax relief. The middle-income group of the society would only observe a rather small change in their tax rate.
The objective of these tables is also to enable an easy and obvious comparison to the tax code in place in the particular country. The Estonian flat tax makes such a comparison simple, as the tax rate for every taxpayer in 2010 was 21 per cent and 22 per cent in 2007. The rate dropped to 20 percent in 2015 and remains, at least, until 2018 on that level (Estonian Tax and Customs Board, 2019).
The comparison with the German data is a little bit more complex, and therefore table 6 summarizes it for the year 2011. Table 7 represents the same calculation for Estonian data for 2012. These comparison tables shall help to understand the differences in the tax volumes and tax systems and the different rules. The examples are calculated as first insights and representations of the inner workings of the SPT. A deeper empirical analysis will be needed in follow-up research.
For the sample presented in table 6, we adapted the indicators of the SPT. The adaptations made here have the objective of making the comparison more realistic and bringing the two progressive systems closer together. We changed the secondary indicator to 15, which means the indicator of the second step of formula (1) and the “Cut of line for (4)” was changed to 3.33¯. The impact factor for formula (4) is hence now 3.33¯. This impact factor and thus the 3.33¯ are rather simple to calculate, as they represent only the value of x when the tax rate is 50 per cent. It is easy to adapt the formula further if the progression is too steep or the average tax level too high for the taste of somebody.
Formula (4) came only into use for taxpayers in the groups above an income of 175,000€ a year. The richest four groups penetrated the maximum restriction, and even though their tax rates would be mathematically higher, they were limited to 55 per cent. The importance of this limit can be seen with the help of the fact that the highest earning group of Germans, which is about 0.01 per cent of the population, would have had an index of 258.98. This incredibly high index is even more impressive considering the slow progressivity of formula (4).
Table 6 shows what was expected. Most of the lower-income groups are paying less under the SPT than with the current system, while the higher-income groups would pay more. What is interesting is the group of taxpayers with an income per year between 10,000 and 12,500€. These citizens would pay slightly more under the SPT, which shows that the exceptions and specialized solutions of the German tax code have their effects. Such special needs cannot be respected in a universal system, such as the SPT.
The public income of one group and hence their tax burden under the SPT only surpasses the current system’s income in the population group with an income of 75,000-100,000€, which means that the SPT only leads to a heavier burden for the well earning sections of the population. The group from 75 to 100 thousand euros income per year is already among the 15 per cent top earners in Germany. Graph 1 shows these results clearly.
Graph 1Taxation volume per income group in billion € DISPLAY Graph
Table 6SPT in comparison with the German tax code in 2011 DISPLAY Table
Table 7SPT in comparison with the Estonian tax code in 2012 DISPLAY Table
6 Discussion
The tables show that the SPT keeps in the promise of the descriptive part of the paper. There is not much to say, as the data speak for themselves. These examples were only able to show that the system actually works. A more detailed analysis about the long-term results and societal consequences of the SPT will follow in future research. One thing that can be said is that the SPT, under the applications used in this first example, would shift the tax burden more intensely towards the citizens with more income. Decreasing income inequality would be achieved not only by progression, but also by an aspect that was not represented in the data, because the SPT would observe capital income as well as income and would not grant special conditions for those incomes. The SPT would also decrease administrative expenditures in Germany and would keep the level to the same extent in Estonia.
The weakest and most complicated point of the SPT is the transition from formula (1) to formula (4). In the example of table 6 this point is only of interest for about two per cent of the population (DeStatis, 2015). If we had calculated the example with the values we used for the other examples (30; 1.66¯) the transition would have affected about 13 per cent of the society. In that case, the total tax revenue would have been about 360 billion euros and hence 130 billion euros more than under the design above and the actual system in place. The example also shows that only the top earners are impacted by the transition at all. The example also emphasises that the indicators were adapted correctly. The transition is smooth, and the impact on the taxpayers is minimized in any case.
What is positive is that the examples were also able to show another weakness of the SPT or all simple tax systems in general. One group of low-income taxpayers in Germany has to pay more under the SPT than under the current system. The payment difference between the two systems is marginal for the individual, about 6.25€, but it shows the advantage of a complex taxation system. The needs of one particular group can be respected, which simple systems cannot provide. The simplicity of tax systems is sometimes associated with an increase in injustice, as there are fewer exceptions and thus less individuality is representable. One contradicting issue for this statement is that there is no perfect information and hence that complexity has a decreasing marginal utility when the numerous exceptions have led to a complex system of loopholes. More loopholes mean less tax payment, while increasing the administrative costs that all taxpayers have to bear. A taxpayer can hence profit from the system as long as the necessary information is available for that particular taxpayer. A simple system like the SPT cannot respect any individual problems or aspects – which could only be generated by a complex algorithm. The SPT and simple systems like flat taxes can ensure that everybody is shouldering her or his share of the tax burden without exceptions as the possibility of finding a loophole is eliminated by its simplicity.
The obligation to pay the highest taxation rate, the rate of 55 per cent, affects only the richest 0.2 per cent of the society. Hence the slow progression within formula (4) continues until rather high incomes. The most positive and important aspect of formula (4) is that it makes it possible to ease the rather strong progression of formula (1) in the higher income groups.
Another advantage of the SPT is that the formula inherently adapts to the level of income inequality within a society. The larger the income inequality is, the larger is the spread between the lowest and the highest tax rate. The limit of the tax rate is only determined by politics, as formula (4) allows for a spread of the progression across the entire spectrum of all incomes of a society, hence a spread from 0.0 per cent to 100 per cent. On the other hand, if a hypothetical society were perfectly egalitarian and all incomes were equally high, all incomes would be taxed with the same tax rate. The same mechanism, the average-based calculation, provides the fact that the system adapts automatically to inflation and increases in price levels, as the number remains the same for all and is automatically updated each year. Only an episode of hyperinflation would be problematic for the efficiency of this design, as the much higher incomes in the current year would lead to maximum tax rates for all incomes, which cannot be the target at any point in time, but particularly not in times of a hyperinflation.
It is also clear that a progressive taxation system would trigger negative externalities and spill-over effects if the rest of the tax code were not adapted. A flow towards corporate funds needs to be prevented with a similar tax rate for a company, which could be provided with a slightly more complicated version of this formula or another progressive system.
To validate these results and to investigate the results in more depth, especially the long-term results of an introduction of the SPT, further research with solid empirical data is needed. Future research should also include an analysis of inheritance tax, value-added tax and cooperate tax based on the SPT. This paper was able to give an empirical and theoretical demonstration of the concept. Nevertheless, questions that cannot be answered with the methods and the data used for this paper remain.
The concept or an adaptation of it might be interesting for countries with a tax code that is already rather simple, as the adaptation too would be rather simple. For countries with a more complex system this concept might be more of an inspiration, as the simplification of the tax code goes along with many controversial discussions. The population and special interest groups would work hard to prevent the loss of particular benefits so that the process is rather complex and longlasting, but countries with an already simplified tax code could rather easily adapt such a system in order to fight increasing income inequality or in order to follow a different approach towards simplicity than a flat tax.
8 Conclusion
Simplifying the tax code while employing a flexible progressive tax system is rather unusual, but the literature review has shown that it is the design of working with the adaptations of only one formula and using the yearly societal average income as a tax basis that makes the Simple Progressive Tax unique in comparison to the existing progressive taxation systems.
The tax rate can increase slowly or rapidly, depending on the chosen indicators. The tax rate can be limited to any level and even further simplified when stopped at the over-progressive tax rates of formula (1), as no secondary formula is needed in such a case. The SPT or a similar system can be adapted easily to multiple taxes. Such a system would enable welfare gains, not only because the citizens and the administration would save enormous amounts of time and money, but they would also gain confidence in their state, as an understandable taxation system should be able to increase the confidence in the government and its administration.
This first introductory paper about the concept of the SPT has established that it produces a slow progression for the tax rate, while providing the organisational benefits of a flat tax. Future research will have to show if the results of the concept can hold up in the long-term and if the concept can actually make life easier for the economically weaker members of the society and simplify its administration.
Appendix
Table A1Descriptive statistics for Germany DISPLAY Table Table A2Descriptive statistics for Estonia DISPLAY Table
Notes
* We would like to thank the participants of the FairTax special session of the conference “Enterprise and Competitive Environment 2017” for their comments on a draft of this paper. We would also like to thank Ton Notermans of Tallinn University of Technology for his advice on the paper as well as the two anonymous referees.
1 Friedman wrote: “I find it hard, as a liberal, to see any justification for graduated taxation solely to redistribute income” (Capital and Freedom).
2 Russia in 2001, Serbia in 2003, Slovak Republic and Ukraine in 2004, Romania and Georgia in 2005.
Disclosure statement
No potential conflict of interest was reported by the authors.
References
Bamford, D., 2015. Ethical Taxation: Progressivity, Efficiency and Hourly Averaging. In: Philosophical Explorations of Justice and Taxation, pp. 135–150 [ CrossRef]
Dahlsrud, A., 2008. How Corporate Social Responsibility is Defined: an Analysis of 37 Definitions. Corporate Social Responsibility and Environmental Management, 15(1), pp. 1–13 [ CrossRef]
DeStatis, 2015. Finanzen und Steuern Jährliche Einkommenssteuerstatistik Sonderthema: Werbungskosten. Wiesbaden.
Diamond, P. and Saez, E., 2011. The Case for a Progressive Tax: From Basic Research to Policy Recommendation. Journal of Economic Perspectives, 25(4), pp. 165–190 [ CrossRef]
Estonian Tax and Customs Board, 2019. Tax rates, Tax and Customs Board of the Republic of Estonia. Tallin : Tax and Customs Board [ CrossRef]
Evans, A. J. and Aligica, P. D., 2008. The Spread of the Flat Tax in Eastern Europe: A Comparative Study. Eastern European Economics, 46(3), pp. 49–67 [ CrossRef]
Frank, H., 1995. Steuern im Mittelalter - Weltliche und kirchliche Geld-, Sach-und Arbeitsleistungen besonders in Freiburg. Freiburg: Universität Freiburg.
Friedman, M., 1962. Capitalism and Freedom. University of Chicago Press
Fuest, C., Peichl, A. and Schaefer, T., 2008. Is a flat tax reform feasible in a grown-up democracy of Western Europe? A simulation study for Germany. International Tax and Public Finance, 15(5), pp. 620–636 [ CrossRef]
Ger.BVerfGE87 (1992) BVerfGE 1992, 87, 153 - Grundfreibetrag.
Gorodnichenko, Y., Martinez-Vazquez, J. and Peter, K. S., 2008. Myth and reality of flat tax reform: Micro estimates of tax evasion response and welfare effects in Russia. National Bureau of Economic Research, No. 13719 [ CrossRef]
Hall, R. E. and Rabushka, A., 1983. Low tax, simple tax, flat tax. New York: McGraw-Hill Companies [ CrossRef]
Hayek, F. A., 1956. Progressive Taxation Reconsidered. On Freedeom and Free Enterprise.
Hayek, F. A., 1960. The Constitution of Liberty. Chicago: University of Chicago Press.
Hennighausen, T. and Heinemann, F., 2010. Don’t Tax Me? Determinants of Individual Attitudes Toward Progressive Taxation. ZEW - Centre for European Economic Research Discussion Paper, 10(17) [ CrossRef]
Hobbes, T., 2006. Leviathan. A&C Black.
Keen, M., Kim, Y. and Varsano, R., 2006. The “flat tax (es)”: principles and experience. Public Finance, 15(6), pp. 712–751 [ CrossRef]
Kirchhof, P., 2010. Die Reform des deutschen Steuerrechts. Zeitschrift für Staats- und Europawissenschaften, 8(4), pp. 449–497 [ CrossRef]
Krueger, D. and Ludwig, A., 2016. On the Optimal Provision of Social Insurance: Progressive Taxation versus Education Subsidies in General Equilibrium. Journal of Monetary Economics, 77, pp. 72–98 [ CrossRef]
Mill, J. S., 1852. Principles of Political Economy. 3rd ed.
Musgrave, R. A. and Thin, T., 1948. Income tax progression, 1929-48. Journal of Political Economy, 56(6), pp. 498–514 [ CrossRef]
Nerré, B., 2008. Tax Culture: A Basic Concept for Tax Politics. Economic Analysis and Policy, 38(1), pp. 153–167 [ CrossRef]
Paulus, A. and Peichl, A., 2009. Effects of flat tax reforms in Western Europe. Journal of Policy Modeling, 31(5), pp. 620–636 [ CrossRef]
Porter, M. E. and Kramer, M. R., 2002. The Competitive Advantage of Corporate Philanthropy. Harvard Business Review, 80(12), pp. 56-69.
Reynolds, A., 1999. The international importance of low tax rates. Economic Affairs, 19(1), pp. 48–49.
Rixen, T., 2010. Was kam eigentlich nach Kirchhof? Die Steuer- und Finanzpolitik der Großen Koalition. In: S. Bukow and W. Seemann, eds. Die Große Koalition Regierung- Politik- Parteien 2005-2009, pp. 191–210 [ CrossRef]
Schweiger, G., 2015. Taxation and the Duty to Alleviate Poverty. In: H. P. Gaisbauer, G. Schweiger and C. Sedmak, eds. Philosophical Explorations of Justice and Taxation, pp. 33–46 [ CrossRef]
Smith, A., 1776. The Wealth of Nations - A Landmark Classic. London.
Staehr, K., 2004. Economic Transition in Estonia. Background, Reforms and Results. Contemporary Change in Estonia, (4), pp. 37–67.
Trasberg, V., 2011. Personal income tax in Estonia – who’s burden? Estonian Discussions on Economic Policy, 19(2) [ CrossRef]
|


