5742
Views
536
Downloads |
Evaluation of macroeconomic outcomes and the seven-year membership of Croatia in the European Union
Ivana Rukavina* 
Article | Year: 2022 | Pages: 1 - 42 | Volume: 46 | Issue: 1 Received: June 1, 2021 | Accepted: December 5, 2021 | Published online: March 8, 2022
|

FULL ARTICLE
FIGURES & DATA
REFERENCES
CROSSMARK POLICY
METRICS
LICENCING
PDF
Note: All series are expressed in per capita terms (in thousands, constant 2010 US$). Source: Author.
Note: The percentage difference between real and synthetic value, where a positive (negative) value indicates that the real series is greater than (smaller than) the synthetic series by that percentage. Source: Author’s calculation based on results of synthetic control method estimations.
Note: The mutual movement is based on an index with a common base 2013=100. Changes after 2013 show the movement of the Croatian series and its estimated synthetic controls. Divergence between two lines is seen as changes that occurred after joining the EU. Source: Author’s calculation based on results of synthetic control method estimations.
Note: Income was originally expressed in absolute per capita terms (in thousands, constant 2010 US$). Savings were originally expressed in percentage of GDP. Source: Author.
Note: Income was originally modelled in absolute terms (constant 2010 US$) and it is graphically expressed as the percentage difference between real and synthetic value, where a positive (negative) value indicates that the real series is greater than (smaller than) the synthetic series by that percentage. Savings were originally expressed in percentage of GDP and graphically expressed as the simple difference between the real and synthetic value. Source: Author’s calculation based on results of synthetic control method estimations.
Note: The mutual movement is based on an index with a common base 2013=100. Changes after 2013 show the movement of the Croatian series and its estimated synthetic controls. Divergence between two lines is seen as changes that occurred after joining the EU. Source: Author’s calculation based on results of synthetic control method estimations.
Note: Labour productivity is expressed as GDP per employee (in thousands, constant 2017 PPP $) while sectoral productivity i.e., industry, agriculture and services is expressed in per capita value added (in thousands, constant 2010 US$). Source: Author.
Note: The percentage difference between real and synthetic value, where a positive (negative) value indicates that the real series is greater than (smaller than) the synthetic series by that percentage. Source: Author’s calculation based on results of synthetic control method estimations.
Note: The mutual movement is based on an index with a common base 2013=100. Changes after 2013 show the movement of the Croatian series and its estimated synthetic controls. Divergence between two lines is seen as changes that occurred after joining the EU. Source: Author’s calculation based on results of synthetic control method estimations.
Note: Black line represents the difference (effects) between actual and synthetic Croatia and shows the estimated impact of EU’s accession while the grey lines represent the estimated placebo effects for each country in the sample. Source: Author.
|
|
% effects
(baseline
estimation)
|
Mean %
effects across
1,000 random
donor samples
|
Median %
effects across
1,000 random
donor samples
|
% of estimation
with negative
effects (out of 1,000
random samples)
|
% of estimation
with positive effects
(out of 1,000
random samples)
|
Mean %
effects using best
pre-treatment
accession fit*
|
|
GDP pc
|
-4.39
|
1.34
|
0.75
|
44.57
|
55.43
|
4,62
|
|
Consumption
|
-9.18
|
-6.44
|
-6.52
|
98.86
|
1.14
|
-9.25
|
|
Investments
|
-1.27
|
-7.49
|
-0.94
|
80.28
|
19.71
|
-2.12
|
|
Expenditures
|
-3.61
|
0.10
|
-0.94
|
62.00
|
38.00
|
-1.31
|
|
Imports
|
5.36
|
6.37
|
5.91
|
76.00
|
24.00
|
-4.51
|
|
Exports
|
20.21
|
19.29
|
20.12
|
2.73
|
97.27
|
25.55
|
|
Income
|
2.78
|
1.99
|
3.01
|
31.43
|
68.57
|
5.42
|
|
Savings
|
10.21
|
5.55
|
5.53
|
0
|
100
|
6.68
|
|
Labour productivity
|
-1.21
|
0.41
|
-0.36
|
56.57
|
43.42
|
3.82
|
|
Industry_VA
|
-11.41
|
-16.43
|
-16.63
|
95.57
|
4.43
|
-15.30
|
|
Agriculture_VA
|
-27.81
|
-24.71
|
-23.69
|
99.86
|
0.14
|
-27.22
|
|
Services_VA
|
-3.04
|
-1.44
|
-4.22
|
77.00
|
23.00
|
-3.69
|
* Best pre-treatment fit contains estimates obtained by random sampling that have the root mean squared prediction error (pre-RMSPE) lower than our baseline estimates. Note: The percentage difference as a percent effect is the percentage difference between real and synthetic value, where a positive (negative) value indicates that the real series is greater than (smaller than) the synthetic series by that percentage. Mean (%) is the average of the calculated effects, median (%) is also based on the percentage difference. Source: Author´s calculation.
GDP product and aggregate demand components | GDP pc | Consumption | Investment | Expenditures | Import | Export | DID | -0.42*** (0,13) | -0.52*** (0.14) | -0.48*** (0.12) | -0.38*** (0.14) | 0.39*** (0.14) | -0.32* (0.16) | _cons | 4.15*** (0,13) | 6.84*** (0.15) | 5.56*** (0.18) | 5.37*** (0.18) | 4.37*** (0.27) | 4.70*** (0.26) | R2 | 0.48 | 0.47 | 0.43 | 0.43 | 0.57 | 0.59 |
Income and savings | Income | Savings | DID | 0.26*** (0.12) | 6.48*** (0.96) | _cons | 10.98*** (0.28) | 38.9*** (2.17) | R2 | 0.17 | 0.28 |
Labour productivity, industry, agriculture and services value added | Productivity | Industry VA | Agriculture VA | Services VA | DID | -0.07 (0.06) | -0.03 (0.13) | -0.19*** (0.06) | -0.24*** (0.07) | _cons | 10.67*** (0.08) | 7.15*** (0.22) | 6.44*** (0.11) | 2.29*** (0.15) | R2 | 0.14 | 0.05 | 0.35 | 0.80 |
Note: All variables are expressed in original per capita terms and then expressed in logarithmic value, exception was made for savings which is expressed in percentage of GDP. The estimate is based on a total sample of 29 countries. *** represents significance at 1%, * represents significance at 10%. In parentheses are robust standard errors. Source: Author.
|
Indicators
|
Designations
|
|
GDP pc
|
GDP pc
|
|
Households
and NPISHs Final consumption expenditure (constant 2010 US$)
|
Consumption
|
|
Gross
fixed capital formation (constant 2010 US$)
|
Investments
|
|
General
government final consumption expenditure (constant 2010 US$)
|
Expenditures
|
|
Imports
of goods and services (constant 2010 US$)
|
Import
|
|
Exports
of goods and services (constant 2010 US$)
|
Export
|
|
Adjusted
net national income per capita (constant 2010 US$)
|
Income
|
|
Gross
savings (% of GDP)
|
Savings
|
|
GDP
per person employed (constant 2017 PPP $)
|
Labour productivity
|
|
Industry
(including construction), value added (constant 2010 US$)
|
Industry VA
|
|
Agriculture,
forestry, and fishing, value added (constant 2010 US$)
|
Agriculture VA
|
|
Services,
value added (constant 2010 US$)
|
Services VA
|
|
Population,
total
|
|
|
|
|
|
Covariates
|
Designations
|
|
Trade
(% of GDP)
|
Trade
|
|
Population
growth (annual %)
|
Pop_gr
|
|
Gross
fixed capital formation (% of GDP)
|
Inv_GDP
|
|
School
enrollment, tertiary (% gross)
|
Sch_TE
|
|
Real
effective exchange rate
|
REER
|
|
Employment
in agriculture (% of total employment) (modeled ILO estimate)
|
Empl_agri
|
|
Agricultural
land (% of land area)
|
Agri_land
|
|
Employment
in services (% of total employment) (modeled ILO estimate)
|
Empl_ser
|
|
Employment
in industry (% of total employment) (modeled ILO estimate)
|
Empl_ind
|
|
Unemployment,
total (% of total labor force) (national estimate)
|
Un_empl
|
|
Age
dependency ratio (% of working-age population)
|
Dep_ratio
|
Source: World Bank, WDI (accessed 5 April 2021), Bruegel database (accessed 5 April 2021).
 List of countries for random donor sample: Afghanistan, Albania, Algeria, Angola, Antigua and Barbuda, Argentina, Armenia, Australia, Azerbaijan, The Bahamas, Bahrain, Bangladesh, Barbados, Belarus, Belize, Benin, Bermuda, Bhutan, Bolivia, Bosnia and Herzegovina, Botswana, Brazil, Brunei Darussalam, Burkina Faso, Burundi, Cabo Verde, Cambodia, Cameroon, Canada, Central African Republic, Chad, Chile, China, Colombia, Comoros, Congo Dem. Rep., Congo Rep., Costa Rica, Cote d’Ivoire, Cuba, Djibouti, Dominica, Dominican Republic, Ecuador, Egypt Arab Rep., El Salvador, Equatorial Guinea, Eritrea, Ethiopia, Fiji, Gabon, The Gambia, Georgia, Ghana, Grenada, Guatemala, Guinea, Guinea-Bissau, Guyana, Haiti, Honduras, Hong Kong SAR China, Iceland, India, Indonesia, Iran Islamic Rep., Iraq, Israel, Jamaica, Japan, Jordan, Kazakhstan, Kenya, Kiribati, Korea Rep., Kuwait, Kyrgyz Republic, Lao PDR, Lebanon, Lesotho, Liberia, Libya, Macao SAR China, Madagascar, Malawi, Malaysia, Maldives, Mali, Marshall Islands, Mauritania, Mauritius, Mexico, Micronesia Fed. Sts., Moldova, Mongolia, Montenegro, Morocco, Mozambique, Namibia, Nepal, New Zealand, Nicaragua, Niger, Nigeria, North Macedonia, Norway, Oman, Pakistan, Palau, Panama, Papua New Guinea, Paraguay, Peru, Philippines, Puerto Rico, Qatar, Russian Federation, Rwanda, Samoa, Sao Tome and Principe, Saudi Arabia, Senegal, Serbia, Seychelles, Sierra Leone, Singapore, Solomon Islands, Somalia, South Africa, Sri Lanka, St. Kitts and Nevis, St. Lucia, St. Vincent and the Grenadines, Sudan, Suriname, Switzerland, Syrian Arab Republic, Tajikistan, Tanzania, Thailand, Timor-Leste, Togo, Tonga, Trinidad and Tobago, Tunisia, Turkey, Turkmenistan, Uganda, Ukraine, United Arab Emirates, United States, Uruguay, Uzbekistan, Vanuatu, Venezuela RB, Vietnam, Yemen Rep., Zambia, Zimbabwe. (Accessed 1.10.2021). Source: Author
|
|
|
Abstract
The paper evaluates the Croatia’s seven-year membership in the European Union based on selected macroeconomic indicators by using a methodological approach, counterfactual analysis, and a synthetic control method. The results showed that the effect of the accession stimulated the economic growth and components of aggregate demand, income, savings and sectoral productivity. Also, strong disturbances with the onset of the crisis in 2009 were detected, the effects of which ultimately had a negative consequence in terms of more successful economic integration. Accession to the EU halted the decline in macroeconomic indicators and began a mild, but still insufficient recovery. The research confirms a strong trend of export development after 2013, a strong turn and increase in savings, a strong and significant decline in the value added of the agriculture sector as well as not recovered consumption. Also, the positive effect in the reduction of government expenditures is expressed.
Keywords: European Union; integration; Croatia; macroeconomics; synthetic control method
JEL: F15, O52, O11, C23
1 Introduction
With the opening of pre-accession negotiations in 2005, Croatia was awaiting the moment of accession, which took place on July 1, 2013. Croatia’s accession to the European Union (EU) was a necessary step towards further economic integration. Based on theoretical assumptions, economic integration and accession to the EU generally brings numerous benefits, while more rigorous research warns of the existence of numerous structural determinants and shortcomings that hinder the full exploitation of the potentials. What Croatia has achieved on this issue is explored in this paper. Numerous factors were tested: selected macroeconomic indicators, gross domestic product per capita (GDP pc), components of aggregate demand, income, savings, labour productivity, as well as productivity of industry, agriculture and services. We were interested in what effects would have been recorded if Croatia had never joined the EU. In order to adequately answer this question, we use the synthetic control method that provides a counterfactual situation on the basis of which the impact of membership is assessed. Although the COVID-19 pandemic brought a strong economic downturn, in this paper we do not touch on its impact and consequences. The reason is the lack of data for 2020 and the feature of global systematics.
In Croatia, research on the impact of membership is still rather scarce and has mostly been performed with partial approaches. Certain analyses were performed by Butorac (  2019 2019) where the existence of divergence processes in the macroeconomic indicators of Croatia in relation to the existing transition countries of the EU (countries that joined the Union in 2004 and 2007) as well as certain export achievements that are accompanied by a loss of competitiveness and lagging behind in the technological complexity of the product were found. In the analysis of the economic and fiscal effects of joining the Union, Deskar-Škrbić ( 2019) points to an increase in imports and strong integration through exports, as well as the absence of a significant inflow of foreign equity investments and productivity growth. On the fiscal issue, there have been some budgetary changes and the most important change of participation in the European Semester. Of the other approaches, Škrinjarić and Čižmešija ( 2020) indicate that Croatia’s accession has had a strong positive impact on the business sentiment of Croatian industry. Grgić, Krznar and Bratić ( 2019) indicate that compared to the pre-accession period, in the period 2013-17 there was an increase in agricultural production, but also a decrease in its value, which led to a decline in the share of Croatian agriculture in total EU agriculture. Šelebaj ( 2020) indicates a number of positive changes in the structure of exporters after 2013. Further results on the impact of EU membership taking the example of Croatia and using the synthetic control method can be found in Mirguseinova ( 2018) who, comparing Croatia to other Central and Eastern Europe (CEE) countries, highlights it as the only country with a negative outcome in GDP pc after integration. In addition to that, Campos, Coricelli and Moretti ( 2019) on a sample of 17 EU countries (excluding Croatia), find an exclusively negative outcome in Greek GDP pc and conclude that without integration GDP pc would have been 10% lower on average.
Our findings suggest that Croatia, compared to the hypothetical situation of remaining outside of the EU, has achieved significant increases in exports, a significant increase in savings, a significant decline in government expenditures and household consumption that has failed to recover, as well as a significant decline in agricultural productivity. Also, the analysis showed that after 2013, and especially after 2014 there were some turns and an upward trend of the observed indicators, but the trend did not lead to more serious shifts and dynamic expectations, except in the example of exports in 2019, which recorded above average growth.
The contributions of the work are the following. This research represents the first comprehensive evaluation of Croatian membership using causal dynamic assessments with the synthetic control method. Membership evaluation also generates the effects of harmonizing the legislative and institutional framework that can identify certain deviations. Next, by answering certain questions of the macroeconomic outcome, certain structural shortcomings have been detected, and certain doubts have been supplemented, which has proven to be especially useful within the existing agricultural policy or the fiscal consolidation implemented. Furthermore, in outcomes in which insignificant effects of accession are shown, certain problems have been detected; for example, a strong first-year cut in labour productivity; in investments or in productivity of industry and services the results deviate from the seven-year expectation in despite of their having grown after 2013 which implies that growth was completely insufficient. Finally, through the obtained results, additional spaces have been profiled that may encourage stronger economic performance, i.e., through export orientation; also in addition, significant increases in savings can provide certain economic impulses.
The structure of the article is as follows. The next section provides a theoretical and empirical review of the literature on the impacts of economic integration. The third section describes the methodology, data and sample. The fourth part presents an analysis of the baseline findings in which basic initial dynamic estimates of the effects of membership on macroeconomic variables are given. Section five controls the robustness of the obtained results. Within this chapter, the impact analysis detected strong changes in the observed indicators caused by the 2009 crisis, which led to certain prognostic errors and indicated the absence of crisis shock absorbers, as well as further emphasizing the need for strong and stable macroeconomic fundamentals. The sixth section discusses the results in which they are set in the context of economic issues, supplementing it with adequate research findings. The seventh part is the conclusion.
2 Theoretical framework and research review
2.1 Theoretical framework
The starting point in the overall evaluation of the economic impact of European integration on the domestic economy can be counterfactually explain it by two different theoretical assumptions of the economic growth model. The neoclassical theory of growth (Solow, 1956; Swan, 1956; Mankiw, Romer and Weil, 1992) bases its evolution on the investment of a portion of production through each period under the assumption of the law of diminishing returns on investment in capital. This theory further points to the fact that the long-term dynamics of growth per capita are determined solely by the exogenous impact of the rate of technological change with the possibility of including exogenous effects of the change in rate of savings, investment, or population. In the context of economic integration, the opening of borders that implies a redistribution of labour and capital among states results in temporary changes in increasing growth rates. Over the long term, economic growth determined by the rate of technological change, under the influence of integration, constantly adjusts its growth rate to the new equilibrium, which implies that savings, accumulation of capital or knowledge have a level effect but not scale effects on economic growth. The endogenous theory of economic growth (Romer, 1990) nullifies the assumption of a reduction in the return of capital investment by assuming a positive relationship between the accumulation of savings, knowledge, investment, and long-term economic growth rates. The assumption that knowledge and innovation are public goods that produce positive external and economic effects and that the accumulation of capital that increases core capital is unlimited makes long-term growth rates endogenous by allowing the free market (economic integration) to produce constantly higher growth rates. Vanhoudt (1999) further emphasizes the fact that the historical internal improvement, recovery, and innovation of economies have been driven by endogenous market and institutional strength, and that market opening can change incentives in favour of faster technological change and thus economic growth.
Although the explained effects provide unequivocal implications for economic growth, the overall dynamics of growth and development based on described models is extended through many other determinants. Additional factors that motivate countries to participate in economic integration, such as development perspectives, macroeconomic coordination, effects of productivity and production specialization, competitiveness and complementarity, benefits of trade diversion and GDP increases as well as acceleration and increase intra-regional trade can be found in the literature (for a detailed explanation see: Marinov, 2014).
However, the extent to which the potential of European integration will be used depends mostly on the accession country itself. In fulfilling EU standards and with joining the EU, numerous demands are made, related to strengthening the development component of the public governance system, such as challenges in improving fiscal governance. Significant amounts are transferred from the EU budget (EU funds) to help member states strengthen their economic and social cohesion by producing direct and indirect effects on growth potential. Although some legislative harmonization has been made with EU accession, the institutional and administrative structure is constantly being upgraded. Participation in EU funds emphasizes the importance of internal strengthening through institution building and increasing efficiency, and the successful use of funds is determined by the institutional absorption capacity. The contribution of administrative capacity and in this sense the institutional quality and good political governance are highlighted as an important factor in explaining the different success of participation in EU funds (Tigănaşu, Încalțărău and Pascariu, 2018; Incaltarau, Pascariu and Surubaru, 2019; Van Wolleghem, 2020).
2.2 Research review
Empirical research on the effects of economic integration on national growth often provides conflicting evidence. In general, it can be said that integration leads to growth benefits that are confirmed through increased investment in physical capital, technology and technology transfer (Alhmeida and Fernandes, 2008; Crespo, Ritzberger-Grünwald and Silgoner, 2008; Ehigiamusoe and Lean, 2019), more efficient resource allocation (Henrekson, Torstensson and Torstensson, 1997), more knowledge spillover (Torstensson, 1999), but also the increased magnitude of trade openness (Romer, 1990). Other benefits of the approach to economic integration have been empirically confirmed through the initial adequacy of the institutional framework and sound macroeconomic fundamentals (Klein and Olivei, 2008), the initial adequacy of the implementation of economic reforms that bring cost-effectiveness after integration (Campos and Coricelli, 2012), improving the business environment (Glodowska and Pera, 2019; Škrinjarić and Čižmešija, 2020), as well as reinforcements of convergence processes for small countries (König, 2015) as well as EU countries (Mikulić, Lovrinčević, Nagyszombaty, 2013). Other observations emphasize the importance of different structural intra-state characteristics such as the pension system, social benefits, direct and indirect taxes, foreign remittances, the size of the unofficial economy, etc. as well as inadequate standards and insufficient mutual recognition, problems with public procurement, fiscal barriers and barriers to the diffusion of knowledge and innovation (Rocher and Stierle, 2015; Ilzkovitz et. al., 2007). Thus, opposing views on the impact of economic integration indicate a permanent, negative and downward growth shift (Vanhoudt, 1999), precisely because of social policies, the impact of economic integration on fiscal policy independence as well as income redistribution strategies (Bertola, 2010), inefficient institutional EU structures in mitigating growing trends of socio-economic inequalities (Busemayer and Tober, 2015). Furthermore, one can find the importance of the issue of structural characteristics of CEE countries especially prominent in times of crisis (Alexe, 2012), limiting role of the geographical position in convergence processes, and the clear separation of EU core countries and CEE countries (Borsi and Metiu, 2013). Also, Campos and Coricelli (2012) highlight a key problem of younger democracies or the existence of a high concentration of power of economic elites, which democratic processes alone do not necessarily correct.
Research on the impact of EU Funds is mainly focused on regional growth, but the issue of the impact of funds on macroeconomic growth is also quite important because the funds, among other things, serve to promote economic growth and are an important source of investment financing. In his report, Siefheit ( 2008) highlights several important factors for macroeconomic progress related to EU Funds: (i) EU Funds have a marginal effect on growth, (ii) strong institutional and legal frameworks prevent significant loss of earmarked funds, (iii) the experience of old member states indicates that transfers cannot be a substitute for good economic policy, (iv) EU Funds can be useful for increasing domestic development policy, but are not a magic bullet for solving national problems. Research on this issue is rather scarce, but it can be said that there is a consensus regarding the connection between institutional efficiency and growth. Interesting implications are provided by the research of Bornschier, Herkenrath and Ziltener ( 2004) where the benefits to economic growth from EU accession are confirmed, although these benefits are primarily the result of interstate redistribution within the EU, i.e., the result of intra-community transfer payments. Ederveen, de Groot and Nahuis ( 2006) indicate the differentiation of resource allocation according to the key of productivity or according to the key of rent-seeking. The results of their research indicate that European support through the Structural Funds only has a conditionally positive contribution to growth. The Structural Funds are not in themselves an effective mechanism for growth; however, if they are determined by institutional quality then they promote economic growth. Albulescu and Goyeau ( 2013) show that the Funds do not have clear effects on growth and point out that without the necessary structural reforms, growth based solely on investments through EU Funds represents risky growth.
3 Methodological framework
3.1 Methodology
In evaluating the success of Croatia’s accession to the EU, evaluating the selected set of macroeconomic indicators after 2013, this paper uses an innovative synthetic control method (SCM) and appropriate counterfactual analysis initially developed and presented by Abadie and Gardeazabal ( 2003) and in later stages further supplemented and developed by Abadie, Diamond and Hainmueller ( 2010; 2015).
SCM allows for the comparison of the result of a treatment-affected unit with the result of synthetic non-treatment control units, thus permitting the achievement of an unbiased and objective view of the overall effect of treatment, in our example of EU accession. SCM design is conceived as a case study method that uses a weighting process to create a counterfactual situation providing a rigorous quantitative framework for conducting a comparative case study. In doing so, it is important to provide a set of control units that have no connection with the treatment that is the subject of the research, in this example a set of non-EU countries. The weighting process ensures that the control group is as similar as possible to the treatment unit for the pre-treatment period. The SCM uses these procedures to construct a synthetic control unit from a pool of all potential control units with the result that the obtained synthetic control unit best approximates the most relevant characteristics of the unit exposed to the event/treatment of interest (Abadie, Diamond and Hainmueller, 2010: 494). The basic principle of the SCM procedure is to project the future path of the synthetic control that will mimic the path that would occur in the treated unit in the absence of treatment, thus obtaining a clear picture of the effect of treatment. The advantage of using the SCM approach stems from the fact that an evaluation made using for example a trend or difference in differences (DID, as one of evaluation method) approach may reflect the bias of the results which occur from time-varying factors between the compared units/countries if it is assumed that the fixed effect is constant over time as well as from the application of SCM weights which ensure that the produced pre-treatment trend from the control group is as similar as possible to the unit under the influence of treatment. Also, the advantage of SCM derives from the transparency of weights in the range between 0 and 1, which are subject to deviation comparison and form an integral part of SCM. In addition, SCM represents a dynamic estimate, while DID is a static estimate.
This methodology can be presented in the formal version as follows. Suppose that we have a J+1 unit (in our example a country) in a T period (years) and that the unit J=1 is a subject (Croatia) of a certain treatment (political decisions on EU accession). In this case, units 2,…, J+1 represent potential donors or control units. Period T is divided into two time periods, T0 represents the number of years of the pre-treated period (period before Croatia’s accession to the EU) and T1 represents the post-treated period (period after 2013), so that 1<T0 <T is valid. Suppose the following, Yit1 is a variable of interest with known values before and after treatment, while Yit0 is a counterfactual variable whose estimate is unknown and represents the outcome that would be observed for unit j in time t in the absence of treatment. Let a1t be an estimated effect of the treatment that unit J=1 receives at time T1 , which corresponds to:
As Yit1 is known and observed after treatment, only Yit0 which representing counterfactual variable should be evaluated to find the effect of a1t intervention. The essence of SCM lies in finding a suitable control group of units that can provide a reasonable assessment of this potential missing outcome. As stated, SCM is defined by the weighted average of untreated donor units (countries). Suppose further that W = ( w2,…, wJ+1) is a vector of weights with wj ≥ 0 for j = 2,…, J+ 1 and that w2 +…+ wJ+1 = 1. Each value of W represents a potential synthetic control with the goal of making the weighted average of all countries in the donor pool as similar as possible to the treated unit (Croatia) in the pre-intervention period. Formally written 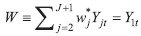 | (2) |
Equation (2) corresponds to the estimate of the counterfactual trend Yit0 . Set up in this way, it allows us to compare the synthetic control unit with the country of interest in the outcome variable in the post-EU period in order to assess the causal effect (Croatia’s accession to the EU).
Suppose further that for each observed variable a certain number of covariates is taken according to the theoretical framework. Let X1 represent (K*1) the vector of their pre-intervention values for the treated country which is further aligned with the predictor matrix or the corresponding covariate values for each variable of interest for the pre-EU period of possible control units defined by X0 which is (K*J) matrix. The vector X1 -X0W defines the difference between Croatia and each country within the donor pool for each of the pre-EU covariates of the selected variable. The vector of optimal weights is: 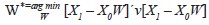 | (3) |
Where v is the ( k*k) matrix which shows the relative importance of each covariate in minimizing the equation. As the optimal weight depends on v, it is important to choose a v that will minimize the difference in the pre-intervention trend of the selected variables of synthetic control and treated unit. The difference is given by root mean squared prediction error (RMSPE).
3.2 Data and sample
The evaluation of the decision on Croatia’s accession to the EU from 2013 was made over a 25-year time span and includes 18 pre-EU years (1995-2012) and 7 post-EU years (2013-19). The variables used in the research are related to economic growth and/or its generators, including GDP per capita, which measures economic growth, and the variable GDP per employee, which measures labour productivity. The study includes components of aggregate demand or consumption, investment, expenditures, import and export. Also, the variables income and savings as well as the gross value added of industry, agriculture, and services as the three most important sectors of the economy are included. As the homogeneity of the values of variables and the reduction of possible deviations between countries to the lowest possible level are important for the application of this methodology, variables are expressed in per capita terms. The coverage of variables in per capita terms does not exclude, i.e., does not reduce or increase the robustness of the assessment and does not create bias. However, in the obtained results, it should be borne in mind that all estimates contain a negative migration balance of Croatia to some extent. We could have opted for a different data coverage, e.g., in logarithmic value or in percentage of GDP, but this would reduce the analytical possibility of the desired estimate in absolute amounts and also some estimates would be largely biased in any combination of the mutual movement of the two indicators. Covariates for the mentioned macroeconomic indicators were selected according to theoretical assumptions. The determinants of growth and aggregate demand components have been extensively researched in the literature, so this paper uses variables such as trade openness, population growth, share of investment in GDP, share of educated inhabitants as an approximator of human capital (more detailed explanation can be found at: Henreksen, Torstensson and Torstensson, 1997; Gyoerk, 2017). To determine the income and savings rate, additional variables of unemployment rate, GDP growth, dependency ratio were selected (see: Nicolescu-Aron and Mihăescu, 2012; Rocher and Stierle, 2015; Furceri and Ostry, 2019). In modelling the productivity, i.e., added value in industry, agriculture and services, variables such as human capital, the share of employees in a particular sector, the area of agricultural land, trade openness, GDP growth are used (explanation can be found in: Bravo-Otega and Lederman, 2004; Eun Kim and Loayza, 2019; Kakar, Kiani and Baig, 2016; Maroof, Husain and Jaward, 2019). Data are mainly collected from the World Bank database and are described descriptively in the appendix. The set of covariates used for each variable, narrowly specified to contain predictor balance for all macroeconomic indicators and country weighs of donor units can also be found in the appendix (table A2). The existence of missing data in predictors in the pre-EU period is generally not a problem in the analysis because all covariates in the model will be generated on averages throughout the pre-EU period.
The next important step lies in the appropriate selection of countries that make up a potential donor pool. Here the donor pool is taken from Campos et al. ( 2019) research that also evaluated the impact of EU membership using the SCM approach. OECD countries and Mediterranean North African countries are included in the research. These are Albania, Argentina, Australia, Brazil, Canada, Switzerland, Chile, China, Colombia, Egypt, Hong Kong, Indonesia, Iceland, Israel, Japan, Korea, Morocco, Mexico, Northern Macedonia, Malaysia, New Zealand, the Philippines, Russia, Thailand, Tunisia, Turkey, Ukraine, and Uruguay. As the SCM approach requires a complete balance of data for outcome variables, some countries have been left out due to data that are missing in some estimates.
4 Baseline results
Based on the previously described methodology, the results are presented below. The real movement of a series of variables of interest in Croatia in the period from 1995 to 2019 is shown with a solid line. The dashed line composed of a weighted set of donor countries is synthetic Croatia, and reflects the situation of non-accession to European integration. The dashed vertical line marks the year of EU accession and the start of a seven-year treatment. After estimating the selected set of macroeconomic variables shown in figures 1, 4, and 7 based on Eq. (1), the results of Croatia’s accession to the EU will be converted into percentage terms. Also based on the obtained results, in order to attain a clear visualization of the movement of the two series and highlight the changes that occurred after integration, an additional methodological step which includes constructing of trends in real and synthetic Croatia after 2013 was made. The mutual movement of the series was recalculated based on an index with a common base in the year of accession to the EU, 2013=100. This way of presenting the results primarily arises from the methodological limitations in the application of the SCM method. Namely, in certain macroeconomic series, the crisis that Croatia faced in 2009 caused significant idiosyncratic shocks that the methodology was not able to overcome, and which led to greater deviations of real and synthetic Croatia in the year of EU accession. Therefore, with an additional analysis of the obtained results through closing the deviations of the two series, we want to show the pure trend of the observed macroeconomic changes that occurred after accession to the EU. For the sake of clarity, the SCM results are presented separately in three parts, GDP pc and aggregate demand components, the second part gives the results for income and savings, while the third part comprises the results for productivity.
4.1 Results for economic growth
The real and synthetic movement of GDP pc (figure 1.1) was determined by the negative deviation which corresponds to the assessment of the accession effect. Synthetic GDP pc very closely replicates the real trend of Croatian GDP pc until 2011, which indicates the resemblance of synthetic control with the actual data set, but also the potential risk in forecasting given the recorded deviations in 2011. The difference between the real and synthetic unit is most prominently visible in 2016, when it begins to gradually decrease and in 2019 reaches a positive level. The average effect was calculated at a negative 4.4%, with the strongest deviation of -7% in 2014 and a positive deviation of 1.2% in 2019 (figure 2). The graded reduction of the difference also speaks of an upward-phase cycle and a faster-growing Croatian GDP pc, which was preceded by a five-year decline. On the other hand, when the initial deviation is closed, the results (figure 3.1) indicate positive jumps in GDP pc only after 2016. The results indicate that since 2016 there has been a further increase in GDP pc, which corresponds to a way out of the crisis of the Croatian economy. Also, these positive developments, despite the initial deviations, led to the final results presented by the SCM method, that Croatia’s GDP pc exceeded the synthetic line in 2019. The results suggest a potential positive future trend of Croatian GDP pc, which implies that a positive outcome in Croatian GDP pc may be visible only in the medium term.
In figure 1.2 a synthetic assessment of the impact of Croatia’s accession to the EU on the example of household consumption is presented. The negative and persistent divergence after 2013 is visually clearly highlighted. Also, there are certain divergences until 2013 in the pre-EU period, to be discussed more in the next section, which make it impossible to accurately project the complete and real consumption outcomes of EU accession. Observing the movement of the synthetic consumption, the beginning of the deviation in 2011 was highlighted, when synthetic consumption began to recover, while Croatian consumption continued to decline, which ultimately led to a marked negative gap in the post-EU period. Real consumption compared to synthetic in the period from 2013 to 2019 fell by -9.2%. Data (figure 2), indicating a decrease in the lag started in 2015 and a deviation of the two lines of -6.5% in 2019 versus a deviation of -8.9% in 2013 and 11.3% in 2014. Data of the mutual movement after 2013 (figure 3.2) indicate that the movement of Croatian consumption does not differ significantly from the movement of synthetic consumption, more specifically only after 2018 is a micro separation of Croatian consumption in relation to synthetic shown. Although these are micro shifts for the seven-year period, it should be noted that since 2014 when a strong five-year decline in consumption was stopped, consumption begins to recover and grow. Nevertheless, based on the results in the short term, negative deviations are not expected to close soon. Croatian consumption doesn’t provide clear evidence of more intense positive future developments, especially if we consider that the level of consumption from 2008 was reached in 2019.
Real investments are also marked by the presence of idiosyncratic shocks that can create certain prognostic deviations due to the impossibility of complete replication by the synthetic line (figure 1.3). These shocks were pronounced on the eve of Croatia’s accession to the EU, i.e., since 2011 when the line of synthetic investments recorded an increase, while the line of Croatian investments shows a further decline. Nevertheless, the specificity of the post-EU period is marked in two ways. Negative three-year deviations were replaced by a positive 15.7% deviation in 2019. Also, given the depth and permanence of the crisis in the year of EU accession, 2014 was a turning point in the constant reduction of investments. According to the SCM method, the results suggest that the four-year post-EU period (2013- 16) can be seen as a kind of bridge for the realization of future positive investments (2017-19) with a further future trend of positive investment. The results presented in figure 3.3 also confirm that investments are recovering after Croatia’s accession to the EU; since 2014 there has been a constant and positive growth trend which implies a future positive investment outcome. Ultimately, the obtained investment outcomes point to the recovery of the investment cycle after accession to European integration, as well as the upward trend of investment. However, the fact that Croatian investments in 2019 are below the level recorded in 2008 should not be overlooked.
The results of the synthetic control unit for government expenditures follow very well the real trend of government spending in the pre-EU period (figure 1.4). After 2013, there is a clearly visible separation between real and synthetic expenditures, which suggests that with the accession, Croatia achieved lower expenditures compared to the situation in which it remained outside the EU. Certain benefits in percentage terms (figure 2) indicate a cycle of -3.0% in 2013, a maximum of -5.7% in 2016, and a minimum of -1.9% in 2019. Overall, the results suggest lower real expenditures compared to synthetic with an average difference of -3.6%. However, the line convergence also suggests the possibility of closing the gap and rising the line of real expenditures above the line of synthetic in the coming periods. The results from figure 3.4, which equalize the start position of actual and synthetic expenditure in the year of accession to the EU, confirm obtained results on reduced expenditures, but also show us that the gap is closed after 2018 when Croatian expenditures rise above the level of synthetic expenditure. In total, both the obtained and the derived results indicate a positive outcome and a reduction in government spending after EU accession.
As for the results of imports (figure 1.5), idiosyncratic shocks in the pre-EU period and certain deviations between the two series are noticeable. Two years before accession, i.e., from 2011 there was a deviation of two lines, synthetic imports show an increase, while the line of Croatian imports is at lower levels, which creates certain prognostic limitations and shortcomings. In the period after 2013, the two series continue the parallel trend until 2015, when a certain level of divergence is observed, expanded additionally in 2019. On average, a 5.4% increase in real imports was generated compared to the synthetic one (figure 2). The results of SCM suggest that real imports have been constantly increasing since 2015, and future import achievements are also related to this trend. In figure 3.5 when the initial methodological deviations are reduced to zero, the positive results of imports are more pronounced after 2014, which implies that in the Croatian economy there was a certain positive effect of integration visible in imports with a tendency for further growth.
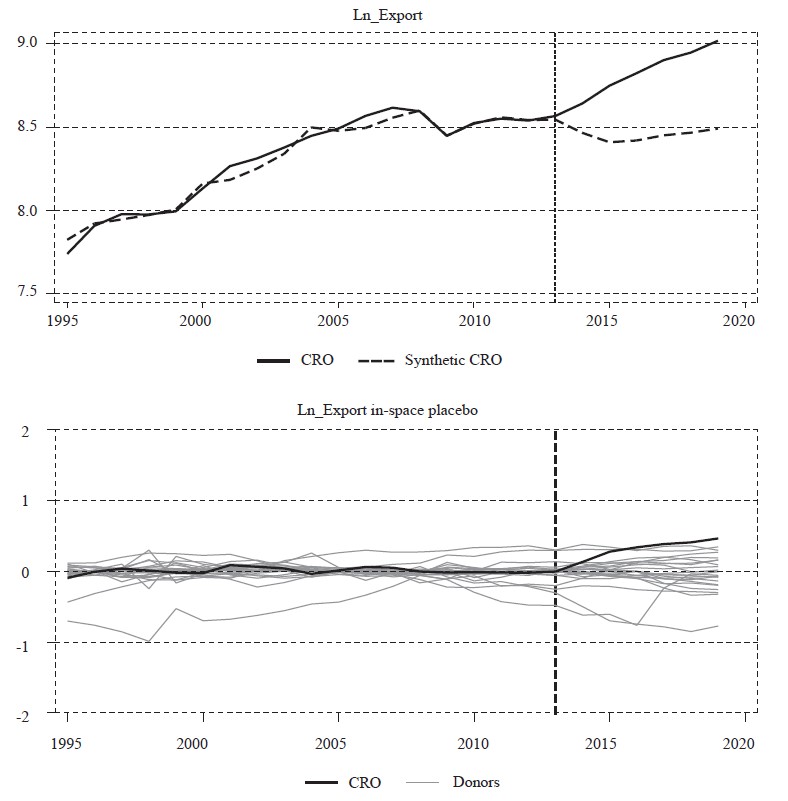
In figure 1.6 results for exports indicate a very good imitation of real Croatian exports in the pre-EU period. The estimates indicate a strong divergence in real and synthetic exports, suggesting that Croatia has benefited significantly from EU accession. After 2013, the discrepancies between the two series indicate that actual Croatian exports significantly exceed the amounts that would have been recorded if Croatia had remained outside the EU. In the seven-year period, Croatian exports increased by 20.5% compared to synthetic exports (figure 2). A constant growth of real exports is present, at the highest level in 2019 and at a difference of 41.2% compared to synthetic. Results of mutual movement with a common base in 2013 (figure 3.6) strongly confirm the originally obtained results. The overall results suggest a tendency for further growth and the creation of additional benefits for the Croatian economy. It is still worth noting the reciprocity in the movement of imports and exports. Although the logical question is whether the increase in exports is neutralized by increased imports, it should be noted that the values of imports and exports differ in the pre-EU period in which the value of imports is at higher levels. Therefore, it can be said that there was indeed a purely export effect within the consequences of economic integration.
Figure 1Results of synthetic control method for GDP pc and aggregate demand components DISPLAY Figure Figure 2Difference in GDP pc and aggregate demand components after Croatia’s accession to the EU (in percent) DISPLAY Figure Figure 3Results of mutual movement synthetic and real line with the same base (2013=100) DISPLAY Figure
4.2 Income and savings
Regarding the results for income and savings shown in figure 4, certain rises are visible in series. The results for income indicate the deviation of the series between real and synthetic Croatia after 2013. But also, the deviation is clearly highlighted two years before accession, in 2011 when synthetic income begins to recover and shows an upward trend, while Croatian income remains below that level, i.e., at lower levels than synthetic income. Such prognostic deviations need to be considered in the further evolutionary context of the analysis, as this leads to an initially larger negative difference in the first two years of membership. Although the effect of the increase in income in the period 2013-18 is visible in its increase by an average of 2.3% (figure 5), the presence of certain deviations in the pre-EU period suggests caution in the conclusions. The results of the mutual movement (figure 6) reduced to the same base (2013=100) confirm that Croatian income with positive performances stands out after 2015. A noticeable trend of income growth and a stronger separation of the real Croatia from the synthetic creates assumptions that in the future, the real income could significantly preponderate the synthetic line. In income modelling, one of the limitations is the incompleteness of income data in 2019, which had to be left out, and which would certainly contribute to stronger visibility of results and a stronger conclusion. Synthetic savings excellently follow the pattern of Croatian savings in the pre-EU period. After 2013, the divergence of the two series is clearly visible, with Croatian savings increasing by an average of 10.2% from 2013 to 2019. As there is a persistent upward trend with a maximum of 14.6% of GDP recorded in 2019 and as further divergence of the two lines is visible in the future, an even more pronounced increase in savings can be expected. These results suggest that after 2013, a certain cumulative of protective and depreciation pillars is created, and also imply a heightened perception of the uncertainty of future economic development opportunities. However, it is necessary to mention the strong decline in synthetic savings after 2013, which may also reflect potential momentum in the faster recovery of other synthetic macroeconomic indicators. Given that the crisis in Croatia lasted much longer than in other countries, possible explanations are found in the large accumulation of national savings which could be placed on the market in the form of investments. Also, the highlighted and significant decline in synthetic savings is certainly influenced by the savings trends of the countries that make up the synthetic savings line (see table A2 in the appendix).
Figure 4Results of synthetic control method for income and savings DISPLAY Figure Figure 5Difference in income and savings after Croatia’s accession to the EU (in percent) DISPLAY Figure Figure 6Results of mutual movement of synthetic and real line with same base (2013=100) DISPLAY Figure
4.3 Labour productivity, industry, agriculture and services productivity
Figure 7 shows the results related to labour productivity expressed as a ratio of GDP per employee, and sectoral productivity of industry, agriculture and services measured by per capita value added of a particular sector. It is immediately noticeable that in each figure the line of the real Croatia is below the line of the synthetic series for Croatia, i.e., that deviations are present. The labour productivity (figure 7.1) of synthetic Croatia follows well the real movement of Croatia in the pre-EU period. It can be seen from the figure that after 2013 a stronger and more persistent divergence was observed with a 4% average decline in labour productivity (figure 8). In the post-EU period, a stronger one-off decline in real labour productivity is noticeable immediately after 2013 lasting one year when productivity takes on an upward trend. Such a one-off decline caused further persistent deviations that did not decrease until 2019 without a clearly visible tendency for the gap to be closed and for mutual convergence to be achieved in the medium term.
The results for productivity in industry shown in figure 7.2 indicate the presence of idiosyncratic shock from 2009 which resulted in an incomplete possibility of synthetic control to cover the approximate movement of Croatian industrial productivity in the pre-EU period, specifically in 2012. Separation of two lines can best be seen in 2010 when there is a strong growth in synthetic industry productivity, while the Croatian productivity line continues to decline until 2013. Such high deviations emphasize the unreliability of results because the synthetic line is not able to fully reproduce real productivity trends. Therefore, these results need to be observed under the influence of methodological limitations, or the impossibility of projecting the real Croatian industry productivity trend. This is further discussed in the next chapter when robustness is checked. Nevertheless, the figure shows a strong discrepancy between real and synthetic Croatia that generated an average gap of -10.7% (figure 8). It should be noted that immediately after 2013, a positive rise in the line of Croatian industrial productivity was recorded, which decreased from the initial 17% lag behind synthetic Croatia in 2013 to 5.3% in 2019. Although it was not possible to close the gap due to methodological limitations, figure 9.2 shows the mutual movement when the obtained lines are reduced to a common base (2013=100) to get a more detailed picture of the outcome. The figure clearly shows that the line of Croatian industrial productivity begins to stand out positively after 2014, with a tendency to continue positive results, which actually corresponds to the recalculated effects of the decline in the lag in the obtained results. Although a strong negative deviation was initially recorded in SCM, one can notice a positive trend of declining deviation, which, when we take into account the performed calculations with a common base, suggests an existing potential to compensate for the initial stagnation of industrial productivity. The suggestion must also be considered through the overall lost industrial productivity from 2009 till 2019, i.e., it has not been compensated even after 10 years.
Figure 7Results of synthetic control method for labour productivity, productivity in industry, agriculture and services DISPLAY Figure
Further in figure 7.3 the added value in agriculture or productivity of the agricultural sector is shown. The figure indicates the presence of idiosyncratic shocks on the Croatian agricultural industry throughout the pre-EU period. The presence of this type of cyclicality indicates certain structural shortcomings that dramatically lowered the potential of agricultural productivity with the onset of the crisis in 2009, which fell below the level recorded in 1995, while the line of synthetic investments remained at higher levels. The results indicate that agriculture recorded a significant deviation in the post-EU period, with an average seven-year gap between Croatia and synthetic Croatia of a negative 28%. The largest deviation between real and synthetic Croatia was recorded immediately after accession to the EU, in 2014 (37.7%) and 2015 (38.5%). Although a cyclical, but also positive trend of Croatian agricultural productivity is visible after 2014, it is still insufficient to close the gap created by the deviation in the near future, so the potential for real agricultural productivity to exceed the synthetic productivity line cannot be seen even in the long run. That conclusion coincides with the result of the series when they are reduced to a common base (figure 9.3) where it is evident that even with the same base (2013=100) the line of Croatian agricultural productivity lies below the synthetic line.
Figure 8Difference in labour productivity, productivity in industry, agriculture and services after Croatia’s accession to the EU (in percent) DISPLAY Figure
Regarding the productivity of the service sector (figure 7.4), the synthetic Croatia line well reproduces the real trend of the Croatian series in the pre-EU period, till 2011. However, it can be observed that the deviations of the two lines from 2011 generated certain deviations after 2013. Although negative differences were recorded in this example after 2013, the trend of their reduction is noticeable due to the acceleration of productivity of the Croatian service sector. These results suggest that with the continuation of this dynamic, the productivity of the service sector will continue to grow above the synthetic line in the near future, recording additional increases in productivity. Although the effects are calculated at an average negative 3.0% they are influenced by initial deviations. When the initial gap is closed (figure 9.4), it is evident that the productivity of the Croatian service sector after 2016 is actually at higher levels, but weaker dynamics are observed.
Figure 9Results of mutual movement synthetic and real line with same base (2013=100) DISPLAY Figure
5 Robustness check and placebo tests
5.1 In-space placebo study
An in-space placebo study determines whether significant differences can be found between the real country under treatment (Croatia) and the corresponding synthetic control unit. The study iteratively applies SCM to each country, in each iteration each of the control countries is assigned treatment from 2013. If the initial results are robust, the method is expected to assess the insignificant effects of treatment on donor countries compared to Croatia, which would be shown by separating the Croatian line from the set of other lines on the chart. If, on the other hand, the series for Croatia fits well into the spectrum of other donor pool series, there is a possibility that the original synthetic counterfactual analysis did not record a significant treatment effect because it suggests that other countries, which did not receive treatment, show greater treatment effects and the initially recorded results could be derived from unobserved factors rather than the impact of accession to European integration. The results for all variables are shown in figure 10. Regarding the results of the greatest robustness for export, savings, and productivity of agriculture (figures 10.6, 10.8, and 10.11), a clear separation of the Croatian line in relation to other lines is visible, suggesting that significant deviations after accession were recorded. However, related to exports, it can be noticed that two lines are above the line of Croatian exports. But, their separation is noticeable before 2013 so robustness still holds. These results are free to be interpreted in accordance with the originally obtained estimates. In the case of GDP pc and aggregate demand components, the separation of lines recorded only in the first years of membership is noticeable, after which they fit into the spectrum of other lines (GDP pc and investments) (figures 10.1 and 10.3), retention of lines on the edge of other lines (consumption households and government expenditures) (figures 10.2 and 10.4), line separation in the last year (import) (figure 10.5) and mention separation of the export line (figure 10.6) which suggests a certain significance of the impact of treatment. The results for savings (figure 10.8) are significantly separated from other lines, especially after 2014, and it can be argued that the originally obtained estimates are robust, while the same argument cannot be identified for income because the separation of the line is not recorded; their line is found within the spectrum of other lines (figure 10.7). In terms of productivity, the results for agricultural productivity (figure 10.11) show a significant path. In the placebo study of service productivity (figure 10.12), the results do not indicate the certainty of the obtained estimate, although the separation of the line is visible in 2014, while labour productivity fits well within other lines and does not represent robust accession effects (figure 10.9). Results for industrial productivity (figure 10.10) show uncertainty of baseline estimation, line of Croatian industry fits well in the spectrum of other lines.
Figure 10Results of the in-space placebo study (all macroeconomic indicators) DISPLAY Figure
5.2 In-time placebo study
The in-time placebo study consists of stochastically assigning a treatment and assessing the effect of the treatment at a time when it did not actually occur. Also, a method of falsification of a treatment which limits the sampling period until the date of full application of the treatment for the reason of avoiding recording its effect. All covariates in the estimates remain as in the original SCM estimates. In essence, these are identical methodological procedures, only in this example for the period from 1995 to 2012. If the application of in-time placebo studies shows significant discrepancies between real and synthetic Croatia, it would mean that the originally obtained results were initiated by chance or through the lack of predictive power of SCM. In order to conduct this study 2005 was chosen, which is also the year of the opening of pre-accession negotiations with the EU, which makes a falsified post-EU period of eight years. The results of the in-time placebo studies shown in figure 8 reflect marked heterogeneity in movements. Unlike Croatia’s actual accession to the EU in 2013, our false accession to the EU in 2005 has no visible effects in household consumption (figure 11.2), investment (figure 11.3), expenditures (figure 11.4), income (figure 11.7), savings (figure 11.8) which gives importance to the originally obtained estimates. Furthermore, what attracts special attention is the separation of synthetic and real Croatia with the onset of the global financial crisis in 2008 and drastic deviations in the series of exports, imports, labour productivity, industry and agriculture (figures 11.5, 11.6, 11.9, 11.10, and 11.11). In examples of imports and exports, it should be noted that the separations show negative deviations, which after the accession to the EU show positive deviations. As for the other findings, we can say that they are strongly influenced by the crisis which led to a shift in the lines. So, these results partly give importance to the initially obtained estimates because the crisis represents a certain idiosyncratic shock which, on the example of Croatia, acted much more strongly in comparison with synthetic control and cannot be attributed to coincidences. However, the shock can cause strong deviations and inaccurate estimates if the synthetic unit does not provide the possibility of replication, which proved to be correct, for example the productivity of industry in the in-space placebo study (figure 10.10). These results also show a strong impact of the global financial crisis on the Croatian economy manifested in the mentioned indicators. The last two variables subjected to the in-time placebo study, GDP pc and service productivity (figures 11.1 and 11.12) reveal the beginning of the divergence of synthetic and real Croatia immediately after 2005, which suggests certain shortcomings in the robustness of the originally obtained estimates because it implies the existence of a false effect in the right treatment.
Figure 11Results of the in-time placebo study (all macroeconomic indicators) DISPLAY Figure
5.3 Random donor sample approach
Due to the problem that we faced i.e., strong pre-EU deviations in some macroeconomic indicators and due the recognition of the fact that our primarily obtained results may be influenced by certain characteristics of donor countries, in this respect they can reflect a certain bias of the estimated results. Also, donor countries may be affected by the spillover effects of Croatia’s EU accession. If there were a spillover effect like the diversion of trade caused by EU membership to a non-EU country that is a part of a donor pool, it would lead to an upward shift in our results. Conversely, if a country in a donor sample experienced another form of idiosyncratic shock, this would lead to a downward shift in our primary results. Considering the above problems, Campos, Coricelli and Moretti ( 2019) proposes the use of a simple and new approach to robustness testing: constructing 1,000 alternative counterfactuals based on alternative donor samples which involves countries randomly selected from the entire donor sample (which contains 159 countries), for each macroeconomic variable. In doing so, each alternative donor sample, randomly selected from a large number of countries, contains the same number of countries as in our baseline assessment. The obtained estimates of the outcomes caused by Croatia’s membership in the EU are converted into a percent and then compared to our baseline estimates. A list of countries for entire donor sample, used in the alternative assessment can be found in the appendix at the end of the paper.
The results of the random donor sample effects, presented in table 1, compare our baseline results and estimated effects of EU membership with the effects obtained using 1,000 alternative and randomly selected samples. The results indicate certain characteristics of the Croatian economy that indicate certain deviations in the estimated effects.
In terms of GDP pc and aggregate demand components, all macroeconomic indicators, except exports, indicate the effects of both overestimating the accession's effects (investment, imports) and underestimating the accession's effects (GDP pc, government expenditures and household consumption). Observing the results, the effects of GDP pc are proven interesting, in which the average effect of our baseline estimate is -4.4% while the mean (median) of alternative estimates is positive and amounts to 1.3% (0.7%). The results are even more pronounced if we look at the best pre-treatment fit in which the effect on the GDP outcome is shown to be positive. Also, government expenditures, which led our primary results to a high level of underestimation, recorded an average (median) difference from 3.5 percentage points (2.7) while the best pre-treatment effect holds negative coefficient as our baseline estimation. What attracts attention are import results which do not provide clear effects and unambiguous conclusions. Namely, the estimated average effect is 5.4%, while the effect of best pre-treatment fit is negative (-4.5%). Also, 76% of the estimates had an average negative effect. The results for household consumption indicate deviations of mean (median) effect from 3.4 percentage points (2.7) while best pre-treatment estimation is in line with our baseline estimates. It can also be said that the baseline obtained effects of investments are deeply overestimated, the mean (median) difference between the baseline obtained estimates of effects and the effects generated through 1,000 alternative iterations is 6.2 percentage points (2.7).
Table 1Results of the random donor samples (1,000 replications) (all macroeconomic indicators) after Croatia’s accession to the EU % effects DISPLAY Table
However, the best pre-treatment fit estimates support to our primary findings. While income results are within the average, savings results show high deviations of mean and median up to a level of about 5 percentage points. Furthermore, substantial deviations of outcomes are found in productivity in industry at mean (median) from approximately 5 percentage points. Labour productivity seems to tend to be positive in both assessments. As for other macroeconomic outcomes, the value added of the service sector and agriculture the results of our baseline effects do not show serious deviations as compared with the effects obtained through alternative donor samples.
5.4 Difference-in-differences approach
Finally, robustness testing is examined by using a difference in differences (DID) approach which estimates average changes over time in the outcome variable of a treated unit relative to average changes in the same variable of an untreated unit. The linear parametric form, the method of ordinary least squares, is most often used as a method of estimating DID and associated standard errors. In relation to SCM, which provides dynamic analysis, estimation via DID is based exclusively on static inference and in this paper is used exclusively as a supplement to SCM estimates in robustness testing procedures. With the use of the DID method it is not possible to record accurately how the effect of Croatia’s accession to the EU changes through time, but it can serve as a tool for additional control of the findings obtained using the synthetic control method (for more about the DID method, limitations, and methods for solving certain DID problems please see: Card and Krueger, 1994; Bertrand, Duflo and Mullainathan, 2001; Abadie, 2005).
The basic equation for this estimate is:
| yit= α + β1treatedi + β2timet + δ(treatedi*timet)+θZit + εit | (4) |
Where yit represents a variable of interest, treatedi is a dummy variable that identifies the treated country (Croatia), timet is a dummy variable that identifies the treated period (2013-2019), treatedi*timet is an interactive DID variable that aims to capture the effect of treatment, Zit are the covariates explained in section 2 and specified for each variable can be found in table A2 in the appendix.
The robustness control by the DID method mainly confirmed our primary conclusions regarding the application of SCM with calculate average changes. However, attention should be paid to the negative coefficient for exports, which showed a positive time effect in the dynamic analysis for SCM. The observed discrepancy in export results can be partly explained by the average changes in the value of exports which are taken into account when estimating using the DID method. Also, the DID estimate takes in all sample countries regardless of missing data, which can lead to certain methodological discrepancies. The average changes (increase) in exports in some countries in the sample may thus reflect a larger increase in exports compared to Croatian exports as well as trend differences, which is ultimately reflected in the obtained results. The appearance of a negative coefficient in exports could primarily be caused by methodological problems that can be found in the application of the DID methodology. Due to the sensitiveness of the application of the DID method, for additional security, an additional SCM assessment of exports (on logarithmic values) was made, which confirmed the stronger robustness of export performance throughout the entire period. The results are in figure A1 in the appendix.
Table 2Results of difference in differences estimation DISPLAY Table
6 Discussion
Although the results are largely inconsistent with theoretical predictions, they point to important implications for structural internal weaknesses, and although this is a very complex correlation structure, it seems appropriate to replicate some summaries of previous research that may partially provide adequate complementarity to poor (good) macroeconomic results.
The crisis that Croatia faced in 2009, lasting until 2014, can be linked to the obtained results. The results of SCM and placebo studies showed crisis effects that left Croatia with stronger negative imbalances that were not automatically resolved by the accession to the EU but were stopped. In the overall crisis situation, the moment of EU accession has had a significant role. As the results have shown, although with a lag, that EU accession has led to a reduction in the differences between real and synthetic macroeconomic indicators, the Croatian macroeconomic reversal to an upward trend, and new development perspectives have certainly been provided. However, the results of the static DID analysis indicate that the upward trends of macroeconomic variables started after 2013 have not yet generated significant positive effects, more precisely, mostly negative average effects are recorded. The exceptions are the positive effects on income and savings. Although our baseline results for GDP pc did not prove significant, in the context of the overall outcome they are analysed. The results of GDP pc are directly comparable with the results from Mirguseinova ( 2018) which show an identical outcome in Croatian GDP pc obtained by the same methodological procedures on different sets of donor countries. These results single out Croatia as the only country in the CEE group with a negative effect. However, it should also be noted that robustness control using alternative donor samples found that our primary results were underestimated to some extent and that the average GDP pc outcome in the alternative estimate was positive. Also, we should keep in mind the results of the baseline estimation when the lines of real and synthetic Croatia are reduced to the same reference point (2013=100) that Croatian GDP pc shows a positive step after 2016 and in the coming years it is above the synthetic line. Given this, one should be careful in making conclusions about positive or negative GDP pc outcomes. Research by Campos, Coricelli and Moretti ( 2019) using the same methodology, which included EU members (1973-2004), indicated significant heterogeneity among countries in terms of GDP pc growth performance with Greece highlighted as the only country which recorded a negative effect. The reasons that led to the positive effects on growth were found by the authors in the actual implementation of pre-accession agreements which provided incentives for economic growth. Although this paper did not directly address this type of analysis, the in-time placebo study (figure 11.1) shows that with the opening of accession negotiations in 2005, Croatia initially diverged from the synthetic unit and opened a deeper negative gap over the years, culminating with the crisis of 2009. However, the divergence that started in 2005 and the divergence in 2013 are separated into two completely opposite phases of the economic cycle. In both cases, the GDP gap was at high levels (see Jovičić, 2017), signalling certain economic imbalances. Therefore, it seems justified to place an even greater emphasis on the complete lack of exploitation of positive (pre-accession and accession) time advantages in solving structural problems and the risks that arise from it.
Despite a slight growth in household consumption, SCM results suggest a decline after EU accession. The baseline results indicate a strong deviation of the two lines in the run-up to EU accession, which speaks to the methodological challenges in projecting real consumption. Furthermore, when the data are reduced to the same reference point (2013=100), Croatian consumption indicates micro separation only in 2019. Other robustness tests (DID and donor resampling) add arguments to the baseline findings. Finally, the in-space placebo study indicates a retention of the Croatian consumption line at the lower edge, where it should either fit into the pool in case of insignificant results or stand out on the upper line in case of a positive and significant outcome. It is also worth noting here that Croatian consumption still indicates a certain upward trend after 2014, but the maximum recorded level of 2008 was exceeded only in 2019. The reasons why a significant increase in personal consumption did not occur after 2013 are primarily reflections of the consequences of the protracted financial crisis of 2009, followed by low purchasing power of the population and the postponement of structural economic shortcomings. We can mention the rigidity of the labour market where some interventions which have led to certain improvements in employment policies have occurred (Tomić, 2019), but the issue of efficiency remains unresolved (Zoretić, 2018). Also, some legislative and structural changes have been made with the aim of releasing a portion of income, such as an amendment to the 2015 Income Tax Act, a package of tax reforms started in 2017 and an administrative salary increase started in 2019, the effects of which have yet to be seen. However, it is to be hoped that the potential income effects will be positively correlated with productivity (Orsini and Perić, 2021). Certain conclusions with accumulated savings can also be drawn here. However, it should be borne in mind that about 80% of the population own only 3.5% of the savings (Jermić and Vrbanc, 2020), which entails other economic implications related to savings issues.
The results of government expenditures significantly indicate its decline after 2013, which can be directly correlated with the successfully implemented fiscal consolidation from 2014, which created the fiscal space. However, the obligation to meet the Maastricht criteria, different budgetary rules, and the adoption of the recommendations of the European Semester should also be mentioned. Although the results of robustness are not maintained after 2017, it is enough to mention that the budget surplus was realized that year, which created the preconditions for the implementation of the comprehensive tax reform. In this context, the current COVID-19 crisis should be mentioned, but also two strong earthquakes in 2020 that require significant financial amounts for their recovery, which again bring high rates of public debt and deficit, with the difference that this time Croatia is struggling on a background of healthier fiscal fundamentals. However, despite these positive outcomes in government spending, it should be mentioned that robustness control showed that they were slightly overestimated, i.e., the average effect in the donor resampling assessment was a bit lower than in our baseline estimation.
The results related to exports indicate its increase, which is in line with the theoretical assumptions of approaching economic integration. After 2013, not only was an increase in exports recorded, but also an accelerated growth or jump, which indicates successful market integration. Similar considerations can be found in Valdec and Zrnc ( 2014) who point to higher sales growth of export companies leading to faster company growth, which is supplemented by Šelebaj ( 2020) who concludes from the evaluation of the EU’s impact on manufacturing exports that there is an increase in the share of small and medium-sized export companies, a concentration of exports, and the emergence of new export companies that have accelerated the recovery of manufacturing productivity as well as the presence of a more prominent gap between the productivity of export and non-export companies. Also, these understandings are confirmed by Orsini and Perić ( 2021) who point to new opportunities for Croatian companies, the acquisition of new market shares and the expansion of new export products. However, when it comes to trade and exports, one should also consider the so-called Rotterdam effect (Rotterdam-Antwerpen effect), which to some extent affects Croatian export performance. It is about quasi-transit transactions and inflating trade in a way that involves only the flow of goods through Croatia thereby increasing the value of trade flows. Thus, Ranilović ( 2017) warns that after 2013 there was a significant increase in the volume of trade transactions, including transactions related to the transport of goods across the Croatian borders. Nevertheless, according to overall analysis, the potential substitution of the generator of economic growth is noticeable in the movement of exports, i.e., the orientation towards the export sector, which provides additional stability for economic growth.
Agricultural productivity is reflected through significant losses after the gaining of access to market integration. It is important to point out that even before 2013, agriculture revealed certain structural problems, to which attention had previously been drawn. Thus, Mihaljek ( 2003: 36-37) states that agricultural products are considered uncompetitive on the EU market; since the level of agricultural protection has been very high in the past, it is estimated that agriculture will be most sensitive to trade liberalization. Tomić ( 2013), analysing the problems in agriculture, states numerous Croatian agricultural potentials and economic implications. Boulanger et al. ( 2013), based on simulation models, predicted an increase in the production volume of most agricultural products and a decrease in most food products, indicating shortcomings in competitiveness. Grgić, Krznar and Bratić ( 2019) point to the results in the increase of agricultural production compared to the pre-accession period of 2.6% and a significant decrease in the value of agricultural production by about 24% the consequence of which is a reduction of the share of Croatian agriculture in total EU agriculture of about 32%. The results of this study indicate the alternation of agriculture and remaining at significantly lower levels, implying that in addition to structural deficiencies, the agricultural sector suffers from a resource equipment lack and technological representation that could lead to some progress and competitiveness. Combined with the continued emigration of the younger population, the complex procedures for implementing the Aliens Act (NN, 133/20) make it difficult for the agricultural sector to provide a vision of future growth potential.
7 Conclusion
This paper evaluates Croatia’s seven-year membership in the EU on macroeconomic data for GDP pc, components of aggregate demand, income, and savings as well as labour productivity, productivity in industry, agriculture, and the service sector. Using counterfactual analysis and the synthetic control method, the possibility of direct evaluation and the answer to the question ‟what outcomes would have occurred if Croatia had not joined the EU in 2013” was given. To obtain such an evaluation, it is necessary to use macroeconomic data from non-EU countries, which in a process of weighting, gives us a copy of the case study of Croatia’s non-accession to the EU. Although this method initially obtained certain conclusions mainly oriented towards the reduction of macroeconomic variables, additional robustness control filtered certain benefits, i.e., the costs of association. The results indicate that the greatest achievement occurred in exports, which recorded successful integration with high growth rates and a tendency for further growth, which suggests a potential departure from traditional consumer-oriented economic growth. Furthermore, government expenditures recorded a significantly lower level, which also corresponds to the successful fiscal consolidation of 2014. Imports are still trying to break through, and although the evaluation is not significant until 2018, it should be noted that there are slight traces of robust estimates for 2019 where imports also show a significant increase. Additionally, savings also proved to be significantly higher after 2013, which suggests an increase in existing domestic capacity, but also implies additional problems related to trust and uncertainty. In the end, household consumption proved unrecovered and was hit harder by the 2009 crisis as it remained outside the transition framework and indications of transition to positive and stable rising growth rates. The productivity of the agriculture sector recorded the largest robust decline. The agriculture sector from 1995-2019 points to the significant structural shortcomings that culminated in the onset of the 2009 crisis. Mere accession to the EU and access to finance for the recovery of agriculture have not had any positive effect in increasing added value. The results suggest that there are certain internal problems that require urgent management.
Other macroeconomic indicators upon which accession has not made any visible or significant impact should also be mentioned. The analysis of the impact of accession on investments showed that they enjoyed recovery and positive growth. However, the growth did not record any very strong shifts that would lead to the possibility of a significant assessment, at least not within this period. Although there are indications that investments could make significant progress in the long run, for such a step it would first be desirable to return investments to pre-crisis levels, on a stable macroeconomic basis. Income proved to be rising with an indication of a further upward trend. Certainly, the methodological impossibility of projecting the actual line of movement proved to be a limitation in income modelling, but there are strong indications that income in longer time series may show significant positive steps. In our analyses, labour productivity shows a negative path after integration. However, due to the existence of a positive outcome in donor resampling, this results is subject to further empirical validation with a longer time series of data. Industry and services productivity were exposed to a strong idiosyncratic shock from 2009 that showed a negative outcome in these two variables. Although there are indications that there is a slight growth of the observed series, it should be noted that industrial productivity has not yet recovered, given that it has not yet reached the level of 2009, while the productivity of the service sector is very slowly separating from the synthetic by an upward trend, but with slower dynamics than is expected.
The limitation of synthetic control method analysis is that it cannot directly test the relative importance of a particular factor or transmission mechanism, identify specific causes or provide insight into the real reasons for poor macroeconomic outcomes, but it can provide insights into the existence of shortcomings and conduct a comparative analysis through time movements and the dynamics of changes over time that can track specific shifts and evaluate desired outcomes. Given the overall results and the time of accession when Croatia was in a deep crisis, the short post-EU period can be cited as a limiting factor in the research. Continuing the previous claim, the idiosyncratic crisis shock that hit the Croatian economy in 2009 led to an incomplete possibility of projecting certain macroeconomic series in the year of accession, which in some indicators created larger deviations compared to the synthetic line, which consequently hindered proper comparison. Finally, the lack of a comparative analysis of the results achieved with those of other EU countries that could help to better position the results obtained can also be singled out.
Hence, future research would do well to focus on a comparative study of these results with CEE countries to dispel doubts that a particular outcome is the result of domestic policy, for example in declining agricultural productivity, and to make an appropriate comparison of Croatia’s performance with that of EU countries. Also, in order to re-evaluate the outcomes in view of the observed upward trend of macroeconomic indicators, it would be useful to repeat the analysis in a longer period. It is also advisable to investigate the causes that have led to the increased volume of savings that can provide growth potentials; however, it can also generate deeper negative risks that need to be detected. Furthermore, it would be recommendable to try to investigate the direct causes of poor macroeconomic outcomes in productivity, and in particular the reasons for lagging agricultural productivity. As this research did not provide insights into the depths of individual indicators, it would be useful to conduct an additional evaluation that would include a purposeful examination of all the essential factors of each indicator.
Appendix
Table A1Variables of macroeconomic indicators and its covariates DISPLAY Table Table A2Pre-EU predictor characteristic for all macroeconomic indicators and its compositions of country weighs of donor units DISPLAY Table Figure A1Synthetic control method for export DISPLAY Figure
Notes
* The author would like to thank two anonymous referees whose comments have contributed to the final version of the paper.
* The author would like to thank two anonymous referees whose comments have contributed to the final version of the paper.
Disclosure statement
The author declares that there is no conflict of interest.
References
Abadie, A. and Gardeazabal, J., 2003. The Economic Costs of Conflict: A Case Study of the Basque Country. American Economic Review, 93(1), pp. 113-132 [ CrossRef]
Abadie, A., 2005. Semiparametric Difference-in-Differences Estimators. Review of Economic Studies, 72(1), pp. 1-19 [ CrossRef]
Abadie, A., Diamond, A. and Hainmueller, J., 2010. Synthetic Control Methods for Comparative Case Studies: Estimating the Effect of California’s Tobacco Control Program. Journal of the American Statistical Association, 105(490), pp. 493-505 [ CrossRef]
Abadie, A., Diamond, A. and Hainmueller, J., 2015. Comparative Politics and the Synthetic Control Method. American Journal of Political Science, 59(2), pp. 495-510 [ CrossRef]
Alhmeida, R. and Fernandes, A. M., 2008. Openness and technological innovations in developing countries: Evidence from firm-level surveys. Journal of Development Studies, 44(5), pp. 701-27 [ CrossRef]
Bertola, G., 2010. Inequality, integration, and policy: issues and evidence from EMU. Journal of Economic Inequality, 8(3), pp. 345-65 [ CrossRef]
Bertrand, M., Duflo, E. and Mullainathan, S., 2001. How much should we trust difference-in-differences estimates. MIT Working paper, No. 01-34.
Bornschier, V., Herkenrath, M. and Ziltener, P., 2004. Political and economic logic of western european integration A study of convergence comparing member and non-member states, 1980–98. European Societies, 6(1), pp. 71-96 [ CrossRef]
Borsi, M. T. and Metiu, N., 2013. The evolution of economic convergence in the European Union. Deutsche Bindesbank, Discussion paper, No 28-2013 [ CrossRef]
Boulanger, P. [et al.], 2013. Analysis of the impact of Croatia’s accession to the EU on the agri-food sectors. Luxembourg (Luxembourg): Publications Office of the European Union [ CrossRef]
Bravo-Otega, C. and Lederman, D., 2004. Agricultural Productivity and Its Determinants: Revisiting International Experiences. Estudios de Economía, 31(2), pp. 133-163.
Busemayer, M. R. and Tober, T., 2015. European integration and the political economy of inequality. European Union Politics, 16(4), pp. 536-557 [ CrossRef]
Butorac, G., 2019. Gospodarski rast, konvergencija i članstvo u EU: empirijski dokazi iz Hrvatske. Ekonomski pregled, 70(2), pp. 173-208 [ CrossRef]
Campos, N. F. and Coricelli, F., 2012. Financial liberalization and reversals: political and economic determinants. Economic Policy, 27(71), pp. 483-513 [ CrossRef]
Campos, N. F., Coricelli, F. and Moretti, L., 2019. Institutional integration and economic growth in Europe. Journal of Monetary Economics, 103, pp. 88-104 [ CrossRef]
Card, D. and Krueger, A. B., 1994. Minimum wages and employment: A case study of the fast-food Industry in New Jersey and Pennsylvania. The American Economic Review, 84(4), pp. 772-93 [ CrossRef]
Crespo, J., Ritzberger-Grünwald, D. and Silgoner, M. A., 2008. Growth, convergence and EU membership. Applied Economics, 40(5), pp. 463-456 [ CrossRef]
Deskar-Škrbić, M., 2019. Ekonomski i fiskalni učinci pridruživanja Hrvatske Europskoj uniji. Političke analize, 9(35), pp. 3-13.
Ederveen, S., de Groot, H. L. F. and Nahuis, R., 2006. Fertile soil for Structural Funds? A panel data analysis of the conditional effectiveness of European cohesion policy. Tinbergen Institute Discussion Paper, No. 2002-096-3 [ CrossRef]
Ehigiamusoe, K. and Lean, H. H., 2019. Do economic and financial integration stimulate economic growth? A critical survey. Kiel, 13(4), pp. 1-27 [ CrossRef]
Furceri, D. and Ostry, J. D., 2019. Robust determinants of income inequality. Oxford Review of Economic Policy, 35(3), pp. 490-517.
Glodowska, A. and Pera, B., 2019. On the relationship between economic integration, business environment and real convergence: The experience of the CEE countries. Economies, 7(2), pp. 1-19 [ CrossRef]
Gyoerk, E., 2017. Economic Costs and Benefits of EMU Membership from the Perspective of a Non-member. Open Economies Review, 25(5), pp. 893-921 [ CrossRef]
Henreksen, M., Torstensson, J. and Torstensson, R., 1997. Growth Effects of European Integration. European Economic Review, 41(8), pp. 1537-1557 [ CrossRef]
Incaltarau, C., Pascariu, G. C. and Surubaru, N. C., 2019. Evaluating the determinants of EU Funds absorption across old and new member states – the role of administrative capacity and political governance. Journal of Common Market Studies, 58(4), pp. 941-961 [ CrossRef]
Jovičić, G., 2017. Procjena potencijalnog rasta i jaza BDP-a u Hrvatskoj. HNB Pregledi, P-38.
Kakar, M., Kiani, A. and Baig, A., 2016. Determinants of Agricultural Productivity: Empirical Evidence from Pakistan’s Economy. Global Economic Review, 1(1), pp. 1-12 [ CrossRef]
Klein, M. W. and Olivei, G. P., 2008. Capital account liberalization, financial depth, and economic growth. Journal of International Money and Finance, 27(6), pp. 861-875 [ CrossRef]
König, J., 2015. European integration and the effects of country size on growth. Journal of Economic Integration, 30(3) pp. 501-531 [ CrossRef]
Mankiw, N. G., Romer, D. and Weil, D. N., 1992. A contribution to the empirics of economic growth. Quarterly Journal of Economics, 2(2), pp. 407-437 [ CrossRef]
Maroof, Z. [et al.], 2019. Determinants of industrial development: a panel analysis of South Asian economies. Quality and Quantity, 53(3), pp. 1391-1419 [ CrossRef]
Mikulić, D., Lovrinčević, Ž. and Nagyszombaty, A. G., 2008. Regional convergence in the European Union, new member states and Croatia. South Eastern Journal of Economic and Business, 8(1), pp. 7-19 [ CrossRef]
Nicolescu-Aron, I. and Mihaescu, C., 2012. Modelling the impact of economic, demographic and social determinants on household saving rate in the former socialist countries (Central and Eastern Europe). Procedia Economics and Finance, 10(2014), pp. 104-113 [ CrossRef]
Ranilović, N., 2017. Primjena gravitacijskog modela u analizi utjecaja ekonomske integracije na hrvatsku robnu razmjenu. HNB Istraživanja I-50.
Romer, P. M., 1990. Endogenous Technological Change. Journal of Political Economy, 98(5), pp. 71-102 [ CrossRef]
Sierheit, R., 2008. EU Funds in EU new member states: available resource and possible economic impact. Society and Economy, 30(2), pp. 191-193 [ CrossRef]
Solow, R., M., 1956. A contribution to the theory of economic growth. Quarterly Journal of Economics, 70(1), pp. 65-94 [ CrossRef]
Swan, T. W., 1956. Economic growth and capital accumulation. Economic Record, 32(2), pp. 334-361 [ CrossRef]
Šelebaj, D., 2020. Mikroekonomski aspekti izvoza hrvatske prerađivačke industrije nakon ulaska u Europsku uniju. HNB Istraživanja I-59.
Škrinjarić, T. and Čižmešija, M., 2020. Has the accession of Croatia to the EU affected business sentiment in industry? Synthetic control method approach. Društvena istraživanja, časopis za opća društvena pitanja, 29(4), pp. 643-663 [ CrossRef]
Tigănaşu, R., Încalțărău, C. and Pascariu, G. C., 2018. Administrative Capacity, Structural Funds Absorption and Development. Evidence from Central and Eastern European Countries. Romanian Journal of European Affairs, 18(1), pp. 39-59.
Tomić, F., 2013. Stanje i mjere unaprjeđenja Hrvatske poljoprivrede u svjetlu pristupa Europskoj uniji. Civitas Crisiensis, 1, pp. 129-142.
Tomić, I., 2019. Employment protection reforms and labour market outcomes in the aftermath of the recession: Evidence from Croatia. Public Sector Economies, 44(1), pp. 3-39 [ CrossRef]
Torstensson, R. M., 1999. Growth, knowledge transfers and European integration. Applied Economics, 31(1), pp. 97-106 [ CrossRef]
Valdec, M. and Zrnc, J., 2014. The direction of causality between exports and firm performance: microeconomic evidence from Croatia using the matching approach. Financial Theory and Practice, 39(1), pp. 1-30 [ CrossRef]
Van Wolleghem, P. G., 2020. Does administrative capacity matter? The absorption of the European Fund for the integration of migrants. Policy Studies, pp. 1-19 [ CrossRef]
Vanhoudt, P., 1999. Did the european unification induce economic growth? In search of scale effects and persistent changes. Weltwirtschaftliches Archiv, 135(2), pp. 193-220 [ CrossRef]
Zakon o strancima, NN 133/20. Zagreb: Narodne novine.
Zoretić, G., 2018. Određivanje kompetencija službenika u javnoj upravi – pregled Republike Hrvatske i odabranih zemalja EU. FIP-Financije i pravo, 6(1), pp. 53-74.
|
|
|
March, 2022
I/2022
|


