|
|
|
Abstract
The primary motives for redistribution were related to the desire to fight poverty and to help the poorest. Later on, other motives emerged, such as the desire to gain social support and the self-interest of rich people who agree to transfer part of their funds provided this increases their utility.
The aim of the study is to present the determinants of willingness to redistribute in a group of Polish students. The case study focuses on sharing behaviour in this group. The survey was conducted among 399 students representing four higher education institutions in Poland. The research, based on a solidarity game, has shown that willingness to share with others depended on gender, the profile of studies and the city of studies.
Keywords: redistribution; gender; income; generosity; social policy
JEL: A13, D31, D64
1 Introduction
Every person that is a member of a group shares some of their resources with others. Meeker ( 1971) points out that sharing and transfer decisions result from “exchange principles”: reciprocity, rationality, altruism, status, consistency, joint gain and competition (rivalry). Thus, individual sharing behaviour may not lead to the results expected at the society/community level. Only the commonality can give each person a better chance of realising their interests independently by participating in the group. Thus, each community should be built and upheld according to the theory of social justice (particularly distributive justice) and fairness (Nicolaïdis and Viehoff, 2012). 1971) points out that sharing and transfer decisions result from “exchange principles”: reciprocity, rationality, altruism, status, consistency, joint gain and competition (rivalry). Thus, individual sharing behaviour may not lead to the results expected at the society/community level. Only the commonality can give each person a better chance of realising their interests independently by participating in the group. Thus, each community should be built and upheld according to the theory of social justice (particularly distributive justice) and fairness (Nicolaïdis and Viehoff, 2012).
So, the desired distribution of resources depends on the adopted definition of fairness and social justice. The theory of social justice derives from the concept of fair distribution of resources among the members of a society. Fair distribution may be determined by the needs, merits, opportunities or outcomes of individual activities (Barr, 1993). It may also result from justice in acquisition or transfer (bequest) of wealth or come from the rectification of unjust acquisition or transfer (Nozick, 1974). Utilitarianists claim that just income distribution exists when total social welfare (utility) is maximised (Rawls, 1991). Assuming diminishing marginal utility, this means the equal distribution of income.
Distribution of income in a society depends on numerous factors, including individual decisions taken at different stages of life and the proverbial luck. Apart from the definition of justice or fairness used, unfair income allocation creates a field for income redistribution that may eliminate undesired inequalities. Redistribution is a government activity aimed at transferring funds or wealth among various groups of citizens. It is an intrinsic element of every social policy aimed at social justice and probably one of the most important functions of the modern state (Tullock, 1997a). By definition, income redistribution means changes in the structure of income distribution in favour of certain groups (or individuals) and at the cost of others (Stiglitz, 2000). The main reasons for redistribution include (Rawls, 1991; Tullock, 1997a; Dagdeviren, Van Der Hoeven and Weeks, 2002): - generosity – people are willing to help those who are worse off than themselves,
- benefits and power – people use redistribution to get power or receive some benefits (e.g. politicians),
- envy – people are afraid of those who are frustrated with income inequality (low income class) and want to reduce their envy,
- utility maximisation when one operates “behind the veil of ignorance”.
As mentioned earlier, the very first motives of redistribution were related to the desire to fight poverty and to help the poorest (Tullock, 1997b). Later on, other motives emerged, such as, for instance, the desire to gain social support (compulsion through the ballot box), or the self-interest of rich people who agree to transfer part of their funds provided this increases their utility (voluntary compulsion) (Barr, 1993; Dagdeviren, Van Der Hoeven and Weeks, 2002; Grossman and Helpman, 1996; Acemoglu and Robinson, 2001; Brunner, Ross and Washington, 2008).
Previous studies indicated a negative correlation between individual willingness to redistribute and level of income (Ravallion and Lokshin, 2000; Alesina and La Ferrara, 2005a). Further experiments in the form of a “solidarity game” (Selten and Ockenfels, 1998; Büchner, Coricelli and Greiner, 2007; Bolle et al., 2012), i.e. studying the declared willingness to share the win, conducted in several countries worldwide, confirmed this thesis. Also, there is a negative correlation between the preference for redistribution and income level (Ravallion and Lokshin, 2000; Alesina and La Ferrara, 2005b). Moreover, the willingness to redistribute is higher in times of prosperity and lower during periods of unemployment (Brunner, Ross and Washington, 2008). Growing income inequality leads, in turn, to more individual support for redistribution (Olivera, 2015). The impact of age on redistribution/solidarity is positive, but it stabilises over time (Kakes and de Winter, 2008). Women’s attitude towards income redistribution is on average more generous than men’s (Eckel and Grossman, 2001; Blekesaune and Quadagno, 2003), partly because women display different financial behaviours (Walczak and Pieńkowska-Kamieniecka, 2018). Individuals are also more generous in public than in private (Montano-Camposa and Perez-Truglia, 2019). Additionally, diversity of social problems in different countries results in people being willing to support the same social and professional groups in a different way (Blekesaune and Quadagno, 2003). In turn van Oorschot ( 2000) stresses that expectation of reciprocity is of great importance for willingness to help. “What have you done, or what can you do for us?” – this is the key question asked by the individual (consciously or subconsciously) while making the decision about any form of help.
The aim of the study is to present the determinants of willingness to redistribute in a group of Polish students. Taking into account this aim, the following two hypotheses were assumed: Hypothesis 1: Women are more willing to redistribute than men. Hypothesis 2: People think that they are more generous than others.
The presented study is based on a “solidarity game”. Solidarity refers to the ties in a society that come from unities of interests, goals or standards. Solidarity aims at a reciprocal relationship, but a more subtle one than just giving right after one has received (Selten and Ockenfels, 1998). Solidarity is also not altruism as it refers to carrying common burden undertaking joint efforts so as to maximise the welfare of the community. Like the notion of “redistribution” used in the present work, it denotes supporting others, but on the group/community level. Hinrichs ( 1995) even points out that justification of redistribution in a society is based on the “culture of solidarity”/“solidaristic culture” (Karagiannis, 2007). Therefore, solidarity can be understood as a redistributive arrangement (Maarse and Paulus, 2003).
The willingness to redistribute among a group of members, or even widely in a society, is of utmost importance in times of rising inequalities. Analysis of redistributive attitudes of individuals may help to prepare adequate social policy and reduce some of the negative effects resulting from undesired income distribution. As mentioned before, studies of individual willingness to redistribute and to share the win were conducted in several countries. But no such analysis has been carried out in Poland or other Eastern European countries so far. This study, the first research project into the redistributive attitudes of Polish people, fills a significant gap in this field.
2 Methodology
A survey study was conducted in the period from November 2016 to January 2017. In all, 399 students from four higher education institutions located in three cities in Poland, i.e. Warsaw (Central Poland), Toruń (North) and Olsztyn (North-East) participated in the study. In Warsaw the subjects came from two institutions, i.e. the Warsaw School of Economics and the Warsaw University of Technology, in Toruń from Nicolaus Copernicus University, and in Olsztyn from the University of Warmia and Mazury.
In each institution the scheme of the study was the same. The students received a survey questionnaire which consisted of two parts (in the appendix to this paper). The first part included questions regarding their willingness to redistribute while the second part contained particulars which allowed identification of the sociodemographic characteristics of respondents. In the course of the study the respondents were initially informed that theoretically they were randomly assigned to a group of 3 where each person rolls a dice. If they rolled 1, 2, 3, 4, they won, otherwise they lost. Winning means a prize of PLN 10 1 which can be shared with the losers inside the group (players may be in groups of 3 winners and losers). Not knowing the result of the roll (behind the veil of ignorance), the respondents had to decide if and to what degree they would share their prize with other group members. They had to take into account the fact that they may also lose and then they would receive only as much as others declared to share. They were asked to answer the question concerning what part of the win, PLN 10, they would be willing to share with one or two losers from the group. In a further part, the respondents were asked to state their opinion on what part of the prize (PLN 10) other group members would be willing to share with the losers (one as well as two persons) from their group. The students could freely dispose of the amount greater than PLN 0.50.
To realise the research objectives, in the analysis of the study results non-parametric methods were used, i.e. the Mann-Whitney U Test, Kruskal-Wallis test with multiple comparison tests and Spearman’s rank correlation. The use of non-parametric tests resulted from the lack of normality regarding variable distribution. SPSS version 24 for Windows was used to conduct all the analyses. The Mann-Whitney U test is used to compare distributions in two groups of variables which are at least ordinal in character. It can be used for continuous variables and also for small samples of subjects (Nachar, 2008). The Mann-Whitney U test is valid for data from any distribution, when, for example, there is no assumption regarding normality of distribution. This is an important advantage of this test which makes it a frequently used alternative to the t-Student test (Wild and Seber, 2011). In a general form, the null hypothesis of the test states that the two analysed distributions are the same (equal population means or medians) and the alternative states the opposite (Feltovich, 2003).
The Mann-Whitney U test for large samples (up to n1=n2=12), when both sample sizes are 10 or greater, follows the normal distribution, with parameters (Wild and Seber, 2011): 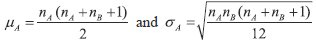 | (1) |
The test is verified using the normal approximation of the U distribution.
We also used in this research the Kruskal-Wallis test. This is a more generalised form of the Mann-Whitney U test. The Kruskal-Wallis test is an extension of the two group Mann-Whitney U test. Like the Mann-Whitney U test, it can be used for data that are at least ordinal in character. The null hypothesis of the test states that the medians of all the compared groups are equal with the alternative hypothesis stating that at least one group has a median significantly different from the rest of the population (McKight and Najab, 2010). Rejection of the null hypothesis means that at least two groups are different (distributions are different). We would also like to know in what way these distributions are different. In order to understand this, we used the Bonferroni multiple comparisons procedure (Vargha and Delaney, 1998; Elliott and Hynan, 2011).
3 Results
In the study 399 students from four higher education institutions located in three cities in Poland took part. These were both women and men, students of economic and non-economic profiles. The respondents were from undergraduate as well as postgraduate studies, both in full-time and part-time form. The characteristics of respondents are presented in table 1.
Table 1Characteristics of the group DISPLAY Table
The average age of subjects was 22.4 years. The average net income per capita in their households was PLN 2,399.93, yet it may be observed that it varied depending on the student’s place of permanent residence. It was the highest among students in Warsaw (PLN 3,996.64) and significantly lower among students from Olsztyn (PLN 1,498.86) and Toruń (PLN 1,353.40).
The results of the study indicate that 20% of the subjects would not share their prize in the case in which one person lost in their group, yet in the event of there being two losers as many as 22.6% subjects would keep the prize to themselves. Average amounts of the prize (PLN 10) which the respondents would be willing to share with one or two losers as well as the sums that in their opinion other winners would share with the group are presented in graph 1.
Graph 1Mean declared amounts shared with one and two losers by the respondents if they win PLN 10 and amounts shared by other winners with the group in the respondents’ opinion DISPLAY Graph
The study shows that the willingness to redistribute, measured with the amount of shared sums increases with the number of people who “lost” in the group. However, as mentioned before, an increased number of losers in a group results in a greater number of respondents who do not intend to share their prize at all. If the respondents are in a group of two winners and one loser, on average they are willing to share almost one quarter (PLN 2.38) of their prize. In the event in which there are two losers in a group, they declare they will transfer nearly one third of their prize (PLN 3.27). Moreover, they consider themselves to be more generous than other, randomly selected members of the group. They claim that they will share more with one as well as two losers than others will (in both cases on average more by about 20%).
With the use of the Mann-Whitney U test it was confirmed that there are significant differences between women and men with regard to the amounts of money shared. Women proved to be more generous than men, both with regard to the amounts of money they are willing to share as well as the amounts they think others would share (not knowing the gender of other group members). Women generally give more, which results from the fact that mean ranks for women are higher than for men, so the first hypothesis was supported (see table 2).
Table 2How much money the respondents want to give to one and two losers and how much money they think others give – depending on gender (Mann-Whitney U Test) DISPLAY Table
A similar regularity may be observed while analysing mean values declared by the respondents. Women are willing to share about 43% more with one loser and about 34% more with two losers than men. Just like men, women claim that others are less generous than them. However, women also claim that others are more willing to share their prize (PLN 2.12 with one and PLN 2.83 with two losers) than men do (PLN 1.66 with one and PLN 2.37 with two losers). Therefore, men declare their own smaller generosity and perceive others as less generous. The difference between women and men regarding the amounts shared by others with one loser is 28% and 19% with two losers.
In the article it has also been assessed whether winners who declare to share higher amounts with the losers think that others will also be more generous. For this purpose, the respondents were divided into three ranges in accordance with declared amounts: different for amounts shared with one loser (up to PLN 1, from PLN 1 to 3, over PLN 3) and different for amounts for two losers (up to PLN 1, from PLN 1 to 5, over PLN 5) due to lower amounts declared for one loser and higher for two losers. Next, the average amounts shared by the respondents and other group members in particular ranges were compared. As a result of Kruskal-Wallis tests where mean variable levels were compared, it may be concluded that there are statistically significant differences among them. Similar regularities may be observed when comparing the means (graphs 2 and 3).
Graph 2Mean declared amounts to be shared with one and two losers by the respondents if they win PLN 10 and amounts that will be shared by other winners with the group in the respondents’ opinion DISPLAY Graph Graph 3Comparison of how much respondents from particular ranges will on average share with 2 losers and how much they think others will share with 2 losers (in PLN) DISPLAY Graph
On the basis of these data two basic conclusions can be drawn. Firstly, it can be observed that more generous persons claim that others are also more generous. As the amount shared by the respondents with other losers increased, they thought that others would also be willing to share more with the losers. Secondly, it was again confirmed, that the respondents perceive themselves as more generous than others. Thus the second hypothesis was supported. Only those willing to share with one and two losers the lowest amounts from their prize of PLN 10 claimed that others would share more. For instance, the respondents from the first range (i.e. up to PLN 1) were willing to share on average PLN 0.23 with one loser, but they claimed that others in this situation would share PLN 0.97. On the other hand, respondents willing to share the highest amounts with one loser (i.e. from the range over PLN 3) on average wanted to share PLN 3.92 and they claimed that others would share PLN 2.78 (graph 2). The situation is similar in the case of sharing with two losers where the respondents from the highest range (i.e. over PLN 5) on average wanted to share PLN 5.49 with the losers and claimed that others in this situation would share only PLN 4.05 (graph 3).
With the use of the Mann-Whitney U test it was also concluded that there are significant differences between students of economic and non-economic profiles with respect to the shared amounts. Comparison of mean ranks indicates that the students of economic profiles are more generous and they expect others to be more generous, by contrast to non-economic profiles (see table 3).
Table 3How much money the respondents want to give to one and two losers and how much money they think others will give – depending on the study (Mann-Whitney U Test) DISPLAY Table
A similar regularity may be observed when analysing the means. For instance, the students of economic profiles were willing to share PLN 2.47 on average with one loser whereas the students of non-economic profiles were 33.5% less willing. In the opinion of students of economic profiles, others would be also more generous. They claimed that others would share PLN 2.80 with two losers while the students of non-economic profiles thought this amount would be lower by 37.9%.
Additionally, the Mann-Whitney U test was conducted in order to evaluate if there is a link between the declared amount and the level of studies. P-value higher than .05 was obtained, therefore the null hypothesis regarding lack of correlation between the above mentioned variables was not rejected.
The results of Spearman’s rank correlation indicate that age, place of permanent residence and mean net income per person in the subject’s household were not significant. Therefore, these variables do not correlate with respondents’ willingness to share part of their prize with the losers as well as with the respondents’ opinion of others’ willingness to redistribute.
In the study presented in this article conducted in institutions of higher education in Warsaw, Toruń and Olsztyn it was also assessed if there were differences in answers given by students from these cities. As a result of the Kruskal-Wallis tests conducted it may be stated that there were statistically significant differences, but only between the students from Olsztyn and those from Toruń (p-value ≤.005) (see table 4).
Table 4Testing the relationship between the declared amount and the city of studies (Kruskal-Wallis test) DISPLAY Table
The comparison of mean amounts indicates that in each of the cases above where statistically significant differences were observed, students from Olsztyn were definitely less generous than students from Toruń. They were willing to share lower amounts with two losers, and also they claimed that others would share lower amounts, with one as well as two losers.
4 Discussion
Our research generally confirms the results of other studies where it is analysed whether demographic factors influence generosity and willingness to redistribute. There is evidence in the literature that social and economic behaviour varies with respect to gender. Many authors (Eckel and Grossman, 1998; Warner, 1991; Oswald and Powdthavee, 2010; Cox and Deck, 2006; Chaudhuri and Gangadharan, 2003) signal that gender determines generosity, preferences toward redistribution and altruism. Nonetheless, it may be observed that this impact is not unambiguous and equal. Alesina and La Ferrara (2005b) prove in their research that women are 4 percentage points more likely to give the highest support and 3 percentage points less likely to give the lowest support to the poor. Landry et al. (2005) find that contributions to public good are higher when women are involved in their raising. In effect, women are more likely to conduct effective collections and charities than men. By contrast, Brown-Kruse and Hummels (1993) and Cox (2002) suggest that men are more generous than women. Also, Cox and Deck (2006) on the basis of their research conclude that there is no simple and unambiguous answer to the question regarding who is more generous as it depends on the decision context, like social distance between the decision-makers and others, total monetary cost of generosity, or occurrence of reciprocal motivation. However, in our study we prove that women are more generous, they are willing to share bigger amounts with others and, therefore, they display a higher level of reciprocity than men do.
Jung et al. ( 2014) also claim that our behaviour is heavily influenced by the perception of the behaviours of others. We observe others and our beliefs about them impact on how we decide to behave in a particular situation. Moreover, people tend to think that they are fairer and more generous than others (Epley and Dunning, 2000; Dunning, Meyerowitz and Holzberg, 1989) who, in their opinion, are definitely more selfish. This results from the fact that people prefer to have rather positive than negative beliefs about themselves (Allison, Messick and Goethals, 1989). Thus, as in our study, people think that others are less willing to share what they have, demonstrate less empathy and a lower degree of reciprocity than themselves.
Another issue broadly discussed in the literature is whether the rich are less willing to redistribute than the poor. Alesina and La Ferrara ( 2005b) state that the impact of income on preferences for redistribution is complex. This is reflected in the results of numerous studies conducted worldwide. For instance, Andreoni, Nikiforakis and Stoop ( 2017) claim that there are no differences in pro-social preferences between the poor and the rich. Also, Schervish and Havens ( 1995) found that generosity is not strongly related with income, but they see the difference between the absolute (the amount which people want to donate for charity) and relative giving (amount donated in relation to the income of a given household). They conclude that though people with a higher level of education are more generous, proportionately, the poor and the rich share the same amount, i.e. the same part of their income. In turn Li ( 2015) thinks that in relative terms people with lower incomes tend to give more. Alternatively, James and Sharpe ( 2007) prove that the poor and the rich have the same willingness to give more. Nonetheless, people with middle incomes are less willing to share with others. In our study we observed that the income of respondents’ households did not impact on their willingness to redistribute the hypothetical prize, nor did their place of permanent residence. Similar observations were made by Yao ( 2015), who claims that the size of residential area is insignificant in terms of charitable giving. We can also find other results in the literature concerning the place of residence (Carroll, McCarthy and Newman, 2005; Regnerus, Smith and Sikkink, 1998; Andreoni and Scholz, 1998) where living in larger communities increases the chances for support to the poorest. But according to the studies of Ma et al. ( 2015) it may be concluded that a rural upbringing produced people who were more generous than those with an urban upbringing.
5 Conclusions
The study shows that people are willing to redistribute when they make decisions behind the veil of ignorance, i.e. in a game with random outcomes. The results indicate a sense of solidarity among Polish students, which increases with the number of people in need.
The results of our research support the two assumed hypotheses. Firstly, women tend to be more willing to redistribute their income than men. Secondly, there is a general human tendency to perceive oneself as more generous than others. The mean value of the amount others would share declared by the respondents was significantly lower than the mean quota that each respondent was willing to distribute individually. Therefore, it can be stated that the declared willingness of the individual to share is significantly different from the assessment of other players’ tendency to redistribute declared by the same individual.
The more people are willing to redistribute, the more they tend to think others will be prepared to redistribute too. In this respect it may constitute a certain reference to solidarity, the sense of community and expectation of reciprocity. The more the individual is willing to help, the more they are convinced that others will also help them in a case in which they are worse off. As a result, one’s generosity determines how other’s generosity is perceived.
The study did not show a correlation between the willingness to share the prize (redistribute) and the level of income, age and place of residence. However, the profile of studies and partially the place of studies turned out to be of significance. Economics students are more willing to share their financial resources than students of non-economic ones. Moreover, they claim that others are less generous than themselves. The reason behind this difference may result from various aspects, such as personality, which determines the choice of study profile, as well as the idiosyncrasies of economic studies that shape the students’ worldview, or both factors jointly. Nonetheless, of importance is the direction of the impact: students of economic profiles are more generous.
The willingness to redistribute, therefore, results from numerous variables, which confirms all previous studies in this area. The research conduct allows us to draw attention to the individual and subjective perception of distribution. This conclusion is especially significant with respect to social policy in any country. Knowing that redistributive policy may meet social approval only if each social group is offered “something” in the long-term, is of utmost importance for policy makers. The sense of community and expectations of mutual benefits may be used to reach a broad social consensus on social transfers, like a “fair solidarity tax” from the richest to the most needy, but not only based on the income criteria.
This study has some limitations. Firstly, other factors, including, for example, the number of persons in the household or marital status of the participants, have not been taken into account. Secondly, according to the original paper we used nonrandom sampling. In order to increase the representativeness of the research future studies with random sampling should be conducted.
Appendix
Table A1Survey questionnaire DISPLAY Table
Funding
The authors declare no financial or non-financial interests related to the research in this paper.
Notes
* The authors would like to thank to R. Kurach and P. Kuśmierczyk for their comments on the research methods. The authors would also like to thank J. Mieloszyk for conducting the survey at Warsaw University of Technology as well as the two anonymous referees for helpful comments on the paper.
1 Middle exchange rate of July 18, 2019 according to National Bank of Poland is 1 Euro = 4.26 PLN.
Disclosure statement
No potential conflict of interest was reported by the authors.
References
Acemoglu, D. and Robinson, J.A., 2001. A theory of political transitions. American Economic Review, 91(4), pp. 938-963 [ CrossRef]
Alesina, A. and La Ferrara, E., 2005a. Ethnic diversity and economic performance. Journal of economic literature, 43(3), pp. 762-800 [ CrossRef]
Alesina, A. and La Ferrara, E., 2005b. Preferences for redistribution in the land of opportunities. Journal of Public Economics, 89(5-6), pp. 897-931 [ CrossRef]
Allison, S. T., Messick, D. M. and Goethals, G. R., 1989. On being better but not smarter than others: The Mu-hammad Ali effect. Social Cognition, 7(3), pp. 275-295 [ CrossRef]
Andreoni, J. and Scholz, J. K., 1998. An Economic Analysis of Charitable Giving with Interdependent Preferences. Economic Inquiry, 36(3), pp. 410-428 [ CrossRef]
Andreoni, J., Nikiforakis, N. and Stoop, J., 2017. Are the rich more selfish than the poor, or do they just have more money? A natural field experiment. NBER Working Paper, No. 23229 [ CrossRef]
Barr, N., 1993. Ekonomika polityki społecznej. Poznań: Wydawnictwo Akademii Ekonomicznej w Poznaniu.
Blekesaune, M. and Quadagno, J., 2003. Public attitudes toward welfare state policies: a comparative analysis of 24 nations. European Sociological Review, 19(5), pp. 425 [ CrossRef]
Bolle, F. [et al.], 2012. Multiple motives of pro-social behavior: evidence from the solidarity game. Theory and Decision, 72(3), pp. 303-321 [ CrossRef]
Brown-Kruse, J. and Hummels, D., 1993. Gender effects in laboratory public goods contribution: Do individuals put their money where their mouth is? Journal of Economic Behavior & Organization, 22(3), pp. 255-267.
Brunner, E. J., Ross, S. L. and Washington, E. L., 2008. Economics and Ideology. Evidence of The Impact Of Economic Conditions On Support For Redistribution And Other Ballot. Working Paper 14091.
Büchner, S., Coricelli, G. and Greiner, B., 2007. Self-centered and other-regarding behavior in the solidarity game. Journal of Economic Behavior & Organization, 62(2), pp. 293-303 [ CrossRef]
Carroll, J., McCarthy, S. and Newman, C., 2005. An Econometric Analysis of Charitable Donations in the Republic of Ireland. The Economic and Social Review, 36, pp. 229-249.
Chaudhuri, A. and Gangadharan, L., 2003. Gender Differences in Trust and Reciprocity. Working Papers, No. 136. University of Auckland, Department of Economics.
Cox, J. and Deck, C., 2006. When Are Women More Generous than Men? Economic Inquiry, 44(4), pp. 587-598 [ CrossRef]
Cox, J., 2002. Trust, reciprocity, and other-regarding preferences: Groups vs. individuals and males vs. females. In: Zwick, R., Rapoport, A. ed. Advances in Experimental Business Research. Boston: Kluwer, pp. 331-350.
Dagdeviren, H., Van Der Hoeven, R. and Weeks, J., 2002. Poverty reduction with growth and redistribution. Development and Change, 33(3), pp. 383-413 [ CrossRef]
Dunning, D., Meyerowitz, J. A. and Holzberg, A. D., 1989. Ambiguity and Self-Evaluation: The Role of Idiosyn-cratic Trait Definitions in Self-Serving Assessments of Ability. Journal of Personality and Social Psychology, 57(6), pp. 1082-1090 [ CrossRef]
Eckel, C. C. and Grossman, P. J., 2001. Chivalry and solidarity in ultimatum games. Economic Inquiry, 39(2), pp. 171-188 [ CrossRef]
Elliott, A. C. and Hynan, L. S., 2011. A SAS® macro implementation of a multiple comparison post hoc test for a Kruskal–Wallis analysis. Computer methods and programs in biomedicine, 102(1), pp. 75-80 [ CrossRef]
Epley, N. and Dunning, D., 2000. Feeling "Holier Than Thou": Are Self-Serving Assessments Produced by Errors in Self- or Social Prediction? Journal of Personality and Social Psychology, 79(6), pp. 861-875 [ CrossRef]
Feltovich, N., 2003. Nonparametric tests of differences in medians: comparison of the Wilcoxon–Mann–Whitney and robust rank-order tests. Experimental Economics, 6(3), pp. 273-297.
Grossman, G. M. and Helpman, E., 1996. Electoral competition and special interest politics. The Review of Economic Studies, 63(2), pp. 265-286 [ CrossRef]
Hinrichs, K., 1995. The impact of German health insurance reforms on redistribution and the culture of solidarity. Journal of Health Politics, Policy and Law, 20(3), pp. 653-687 [ CrossRef]
James, R. and Sharpe, D., 2007. The Nature and Causes of the U-shaped Charitable Giving Profile. Nonprofit and Voluntary Sector Quarterly, 36(2), pp. 218–38 [ CrossRef]
Jung, M. H. [et al.], 2014. Paying More When Paying for Others. Journal of Personality and Social Psychology, 107(3), pp. 414-431 [ CrossRef]
Karagiannis, N., 2007. Solidarity within Europe/solidarity without Europe. European Societies, 9(1), pp. 3-21 [ CrossRef]
Landry, C. [et al.], 2005. Toward and Understanding of the Economics of Charity: Evidence from a Field Experiment. NBER Working Paper, No. 11611 [ CrossRef]
Li, Y., 2015. The flow of soul: a sociological study of generosity in England and Wales (2001–2011). In: Li, Y., ed. Handbook of Research Methods and Applications in Social Capital. Cheltenham: Edward Elgar.
Ma, Q. [et al.], 2015. What makes you generous? The influence of rural and urban rearing on social discounting in China. PLoS ONE, 10(7), pp. 1–11 [ CrossRef]
Maarse, H. and Paulus, A., 2003. Has solidarity survived? A comparative analysis of the effect of social health insurance reform in four European countries. Journal of Health Politics, Policy and Law, 28(4), pp. 585-614 [ CrossRef]
McKight, P. E. and Najab, J., 2010. Kruskal‐Wallis Test. In: The corsini encyclopedia of psychology. Haboken: John Wiley & Sons [ CrossRef]
Meeker, B. F., 1971. Decisions and Exchange. American Sociological Review, 36(3), pp. 485-495 [ CrossRef]
Montano-Campos, F. and Perez-Truglio, R., 2019. Giving to charity to signal smarts: evidence from a lab experiment. Journal of Behavioral and Experimental Economics, 78, p. 193 [ CrossRef]
Nachar, N., 2008. The Mann-Whitney U: A test for assessing whether two independent samples come from the same distribution. Tutorials in Quantitative Methods for Psychology, 4(1), pp. 13-20 [ CrossRef]
Nicolaïdis, K. and Viehoff, J., 2012. The Choice for Sustainable Solidarity in Post-Crisis Europe. In: G. Bajnai [et al.], eds. Solidarity: For Sale? The Social Dimension of the New European Economic Governances. Europe in Dialogue. Gütersloh: Bertelsmann Stiftung, pp. 29-34.
Nozick, R., 1974. Anarchy, State, and Utopia. New York: Basic Books.
Olivera, J., 2015. Preferences for redistribution in Europe. IZA Journal of European Labor Studies, 4(14), pp. 1-16 [ CrossRef]
Oswald, A. and Powdthavee, N., 2010. Daughters and Left-Wing Voting. Review of Economics and Statistics, 92(2), pp. 213-227 [ CrossRef]
Ravallion, M. and Lokshin, M., 2000. Who wants to redistribute?: The tunnel effect in 1990s Russia. Journal of Public Economics, 76(1), pp. 87-104 [ CrossRef]
Rawls, J., 1991. Theory of Justice. In: J. Arthur and, W.H. Shaw, eds. Justice and Economic Distribution. Upper Saddle River: Prentice Hall.
Regnerus, M. D., Smith, C. and Sikkink, D., 1998. Who Gives to the Poor? The Influence of Religious Tradition and Political Location on the Personal Generosity of Americans Toward the Poor. Journal for the Scientific Study of Religion, 37, pp. 481-93 [ CrossRef]
Schervish, P. and Havens, J., 1995. Do the Poor Pay More: Is the U-Shaped Curve Correct? Nonprofit and Voluntary Sector Quarterly, 24(1), pp. 79–90 [ CrossRef]
Selten, R. and Ockenfels, A., 1998. An experimental solidarity game. Journal of Economic Behavior & Organization, 34(4), pp. 517-539 [ CrossRef]
Stiglitz, J. E., 2000. Economics of the public sector. New York/London: W.W. Norton & Company.
Tullock, G., 1997a. Economics of income redistribution. Boston ; Dordrecht ; London: Kluwer Academic Publishers.
Tullock, G., 1997b. The reality of redistribution. In: J. Neill, ed. Poverty and Inequality. The Political Economy of Redistribution. Michigan: W.E. Upjohn Institute for Employment Research, pp. 127-138 [ CrossRef]
Van Oorschot, W., 2000. Who should get what, and why? On deservingness criteria and the conditionality of solidarity among the public. Policy and Politics, 28(1), p. 43 [ CrossRef]
Vargha, A. and Delaney, H. D., 1998. The Kruskal-Wallis test and stochastic homogeneity. Journal of Educational and Behavioral Statistics, 23(2), pp. 170-192 [ CrossRef]
Walczak, D. and Pieńkowska-Kamieniecka, S., 2018. Gender Differences in Financial Behaviours. Inzinerine Ekonomika-Engineering Economics, 29(1), pp. 123-132 [ CrossRef]
Warner, R. L., 1991. Does the Sex of Your children Matter? Support for Feminism among Women and Men in the United States and Canada. Journal of the Marriage and Family, 53, pp. 1051-1056 [ CrossRef]
Wild, C. J. and Seber, G. A. F., 2011. The Wilcoxon rank-sum test. In: G: Seber, ed. Chance encounters: a first course in data analysis and inference. New York: Wiley, pp. 1-10.
|


